1. Market size: define the tonne before interpreting the growth
The most useful public baseline is Guangzhou Sail Carbon Fiber’s 2025 industry survey, reproduced in full by China Composites Expo. It reports Chinese demand of 132,027 tonnes, compared with 84,062 tonnes in 2024. Crucially, the author constructs this demand indicator from domestic supplier sales plus imports and acknowledges limitations around processing trade. It is an industry estimate of the market served in China, rather than an official census of fiber embedded in products ultimately consumed inside China. Chinese converters also manufacture products for export. [S1]
This report therefore uses physical fiber quantities for the national baseline and company filings for commercial evidence. Carbon fiber, resin-based CFRP, carbon–carbon materials, prepreg, finished components and PAN precursor are different product boundaries. Adding their revenues would count the same material repeatedly. Multiplying national fiber tonnage by a single quoted price would also conceal a wide mix of tow sizes, grades, contract terms and qualifications. A defensible national revenue estimate needs a product-level price and shipment matrix; the public evidence reviewed here does not provide one.
GetFRP’s interpretation is that the increase strengthens China’s role as a manufacturing and conversion center. It does not establish that every Chinese fiber producer has full order books, that every premium grade is interchangeable with imported material, or that the same growth rate can be projected into the next year. Procurement teams should use the national series to judge the depth of the ecosystem, then assess the specific production line and qualified product offered in an RFQ.
A national market indicator, with a visible boundary
The 2025 figures are industry survey estimates. Company financial results below are separately labeled disclosures. No 2026 national full-year result or numerical market forecast is presented.
↔ Scroll horizontally to see the full chart and data table.
Source: Sail 2025 market survey [S1]. Annual demand is a sales-plus-imports indicator, not final domestic consumption.
View the chart data and evidence
| Series | Category | Value | Unit | Evidence / value basis | Reported range | Point note |
|---|---|---|---|---|---|---|
| — | 2024 | 84062 | t | Industry survey | — | — |
| — | 2025 | 132027 | t | Industry survey | — | — |
↔ Scroll horizontally to see the full chart and data table.
Source: Sail 2025 market survey [S1]. Annual production capability, not actual output. Demand divided by capacity is not factory utilization.
View the chart data and evidence
| Series | Category | Value | Unit | Evidence / value basis | Reported range | Point note |
|---|---|---|---|---|---|---|
| — | 2024 | 150130 | t/yr | Industry survey | — | — |
| — | 2025 | 171080 | t/yr | Industry survey | — | — |
| Measure | What it answers | What it cannot establish |
|---|---|---|
| Operating capacity, t/yr | How much annual capability the survey counts as operating | Actual output, saleable yield or customer qualification |
| Domestic supply, t | How much locally supplied fiber the survey includes | China’s total production or export-adjusted final consumption |
| Company shipment volume, t | How much product one reporting entity sold | National market share without aligned export and product boundaries |
| Precursor / CFRP / component revenue | Activity at another stage of the value chain | Additional fiber market value that can simply be added |
2. Domestic supply: more depth, but qualification remains product-specific
Sail’s 2025 supply split is 113,400 tonnes of domestic fiber and 18,627 tonnes of imports. The domestic share is 85.9%. Guangwei’s annual report independently documents its use of the same industry study, including 171,080 tonnes of Chinese operating capacity and a 52.5% global capacity share. That corroborates the published series; it is not a second independent measurement. [S1][S2] Sail estimates that the Toray group still sold about 8,000 to 9,000 tonnes in China in 2025, mostly T700-class standard-modulus fiber, despite tariffs and VAT, and attributes the rise in imports chiefly to Japan and Korea for premium sporting goods. [S1]
A high aggregate domestic share can coexist with imported material in selected applications. A qualification normally covers more than a tensile-strength label: the producer, manufacturing site, precursor route, sizing, resin system and component process may all matter. Changing the fiber can require new process trials and repeat testing even when nominal strength and modulus look similar. Buyers should request the approved material specification and the change-control procedure before treating two suppliers as substitutes.
Capacity announcements deserve a separate register from operating assets. Equipment installation, first fiber, stable saleable production and an approved customer shipment are different milestones. A new line can improve long-term availability while initially increasing sampling work and working-capital needs. Shenying’s H1 2026 filing illustrates the distinction: it reports 38,000 tonnes per year of existing capacity and 22,000 tonnes per year under construction at period end. The existing figure includes 9,000 tonnes per year available from the new Lianyungang base; the entire project nameplate is not treated as commissioned output. [S4] Sail itself puts 2025 utilization at 66.3%, which equals domestic supply divided by operating capacity, and above 70% after adjusting for capacity conversion and lines added during the year; that is the survey author’s calculation, not plant-reported output. This report does not add planned projects to the operating-capacity denominator or compute a utilization rate of its own. [S1]
↔ Scroll horizontally to see the full chart and data table.
- Domestic supply85.9%
- Imports14.1%
Source: Sail industry survey [S1]. Percent of surveyed supply, rounded to one decimal. Domestic supply: 113,400 t; imports: 18,627 t; total: 132,027 t.
View the chart data and evidence
| Series | Category | Value | Unit | Evidence / value basis | Reported range | Point note |
|---|---|---|---|---|---|---|
| — | Domestic supply | 85.9 | % | Industry survey | — | — |
| — | Imports | 14.1 | % | Industry survey | — | — |
3. Chinese carbon fiber manufacturers: compare entities and capabilities
The competitive map contains different business models. Jilin Chemical Fiber Group spans precursor, carbon fiber and downstream conversion; Zhongfu Shenying is a listed fiber producer with expanding application development; Guangwei combines fiber, fabrics, prepreg, carbon beams and other operations. These are useful starting points for supplier discovery, not a ranking of equivalent products. Each buyer should identify the legal contracting entity and the plant actually producing the proposed grade.
Jilin’s provincial government reported 2025 group carbon-fiber sales of 56,000 tonnes and capacity of 70,000 tonnes per year in January 2026. An April government article described 74,000 tonnes per year for the same annual context. The sales figure is consistent, while the capacity scope or timing is not reconciled in those articles. We retain that discrepancy rather than select a convenient number or present a precise national market share. The group includes multiple businesses and should not be confused with a single listed subsidiary. [S5][S6]
For sourcing, the important divide is the supply proposition: repeatable high-volume industrial fiber, a qualified high-performance grade, or a converted semi-finished product. A group with extensive nominal capacity may still have limited availability for one exact sizing or tow format. Conversely, a smaller qualified source may offer greater project value when the cost of changing a mature material system exceeds the saving on fiber alone.
| Company / scope | Verified evidence | Period | Procurement implication |
|---|---|---|---|
| Jilin Chemical Fiber Group | 56,000 t fiber sales; capacity disclosures of 70,000 and 74,000 t/yr [S5][S6] | 2025 | Confirm group boundary, plant and grade; reconcile capacity dates |
| Zhongfu Shenying | 22,488.86 t production; 25,054.28 t sales [S3] | 2025 | Sales exceeded production during inventory reduction |
| Weihai Guangwei Composites | RMB 2.860bn revenue; RMB 603.4m attributable profit [S2] | 2025 | Consolidated product mix differs from a pure fiber producer |
| Zhongfu Shenying | RMB 1.163bn revenue; RMB 70.16m attributable profit [S4] | H1 2026 | Interim company evidence; do not annualize into a national market size |
| Zhongfu Shenying | RMB 1.759bn revenue, +14.44%; RMB 107.2m attributable profit, +70.36%; Q3 revenue −3.09% [S12] | Jan–Sep 2026 | Growth slowed in Q3; the company attributes lower Q3 profit to higher R&D spending |
| Weihai Guangwei Composites | RMB 1.939bn revenue, −2.39%; RMB 199.4m attributable profit, −51.94% [S13] | Jan–Sep 2026 | Q3 hit by lower equipment-grade fiber (−31.60%) and carbon-beam (−25.00%) revenue |
| Jilin Carbon Valley Carbon Fiber | RMB 2.327bn revenue, +24.14%; RMB 114.6m attributable profit, −11.86% [S14] | Jan–Sep 2026 | Listed company within the Jilin group; revenue up while Q3 profit fell 81.96% |
Source: Company filings and provincial government publications [S2][S3][S4][S5][S6][S12][S13][S14].
4. Demand segments: wind volume and high-performance conversion
Application growth should be analyzed at the component level. A wind turbine’s nameplate capacity does not uniquely determine its carbon-fiber consumption; blade architecture, spar-cap design, fiber substitution and the bill of materials control the result. A pressure-vessel program depends on its certified design and qualification path. A sports-equipment order depends on product mix and brand inventory. The same additional tonne can therefore represent very different margins, customer concentration and development effort.
Sail estimates that Chinese enterprises used 64,000 tonnes of carbon fiber for wind applications in 2025: 40,000 tonnes for domestic wind companies and 24,000 tonnes processed into carbon beams for export. This separates two demand channels within China’s conversion industry. The exported-beam portion is fiber content used in processing, not the shipment weight of finished beams; the combined total must not be described as final domestic wind consumption. [S1]
Recent company disclosures illustrate how demand is being converted into business. Shenying’s 2026 interim report says its wind-blade sales volume increased 60% year on year and claims a share of nearly 20% of China’s wind segment, above 75% in hydrogen storage and above 45% in high-end sporting goods and carbon–carbon/carbon–ceramic materials. It also reports new tow formats and product lines. These are company statements about its own portfolio and sales, not growth rates for the whole Chinese wind-carbon market. [S4]
GetFRP’s segment assessment below separates the near-term purchasing question from the longer-term engineering opportunity. Wind offers repeat production once the blade-material system is accepted. Aerospace and emerging aircraft can demand rigorous configuration control while remaining smaller in shipment volume for an individual supplier. Industrial customers can be commercially attractive when a material supplier helps shorten conversion cycles or reduces scrap, even without selling the highest-strength grade.
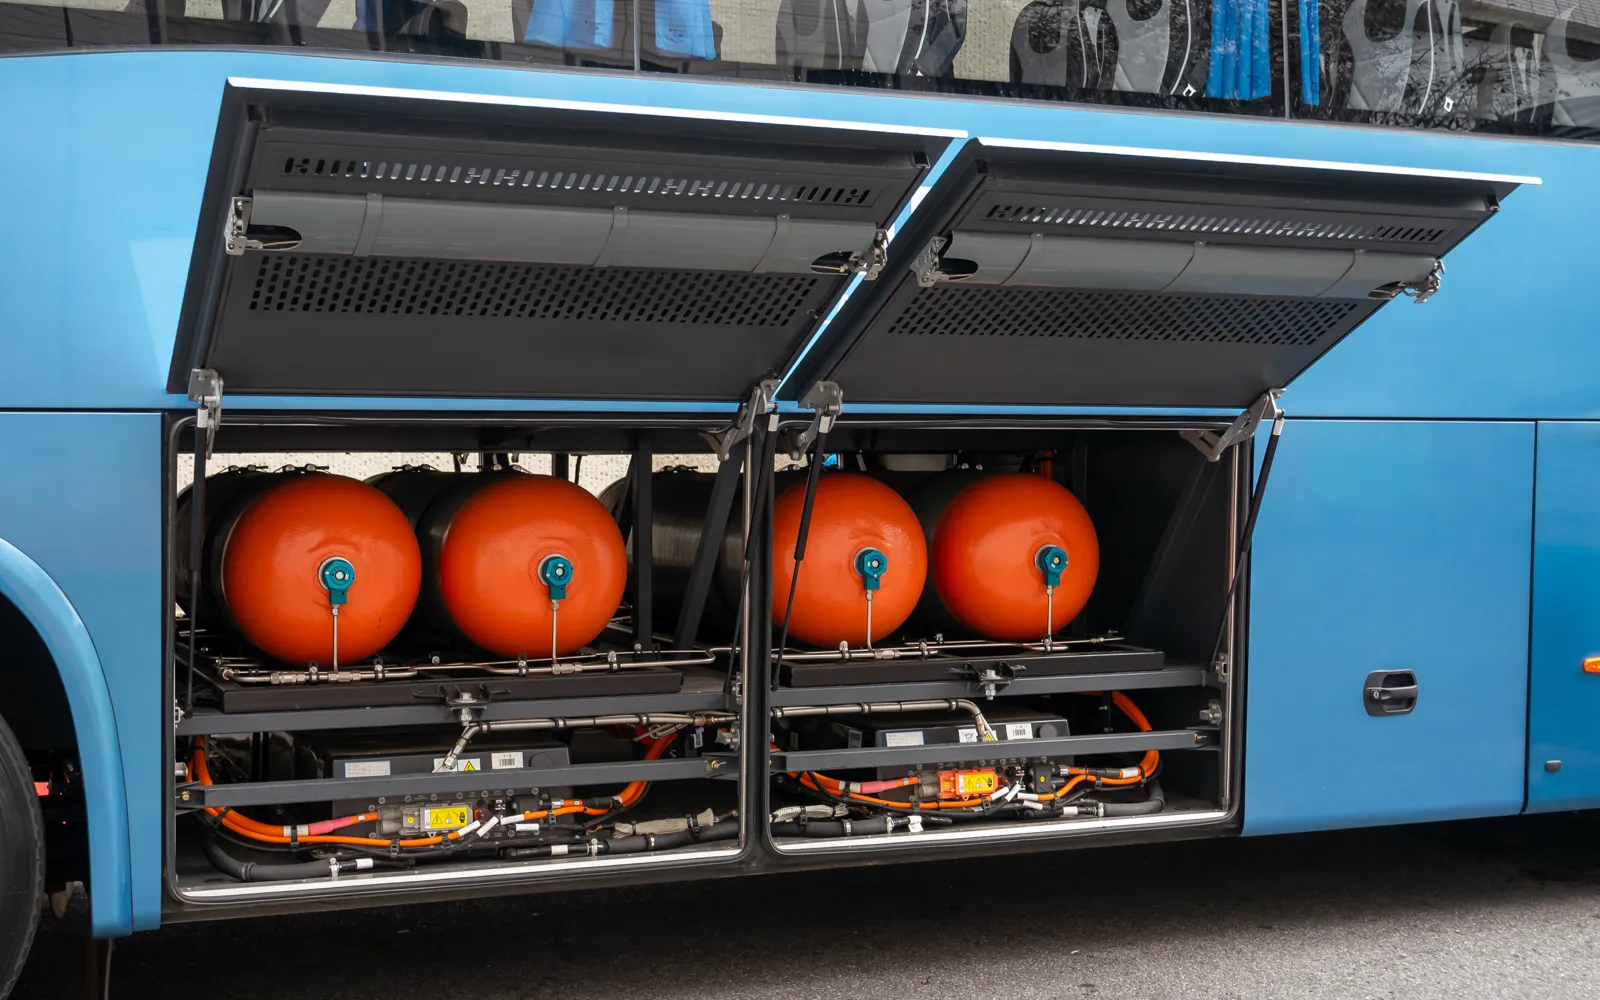
| Application | Material purchasing question | Demand gate | Evidence to request |
|---|---|---|---|
| Wind spar caps | Fiber cost per accepted pultruded laminate | Qualified blade platform and repeat production schedule | Compression / fatigue data, resin compatibility, defect and bond controls |
| Pressure vessels | Mass and cost at the specified vessel performance | Approved vessel design and production qualification | Winding behavior, delivered fiber specification and vessel validation |
| Aerospace / eVTOL | Approved material system and stable process | Program certification and serial build rate | Batch traceability, allowable-property data and controlled changes |
| Sports and leisure | Stiffness, feel, appearance and conversion yield | Brand program, inventory and model cycle | Fabric / prepreg consistency and finished-part trials |
| Automotive / electronics | Component cost and production cycle | Named part award and repeat process capability | Cycle time, scrap, joining, surface and functional tests |
| Carbon–carbon / thermal applications | Fiber architecture and downstream thermal process fit | Converter qualification and end-market orders | Relevant thermal-process and finished-material performance |
Source: GetFRP engineering and commercial assessment; application context supported by company filings [S2][S3][S4]. No segment tonnage is inferred from this matrix.
5. Prices and economics: yield and product mix matter more than one quotation
Public filings provide a more reproducible commercial check than anonymous spot quotations. Shenying disclosed 2025 carbon-fiber revenue of RMB 2.169 billion, sales of 25,054.28 tonnes and a product gross margin of 16.73%. Dividing that revenue by shipment weight gives approximately RMB 86.6 per kilogram. This GetFRP calculation is a historical, blended accounting realization across the company’s products and terms; it is not an October 2026 quotation, a T700 price, or a benchmark for every supplier. [S3] Sail’s survey gives a consistent direction: the average price of China-supplied fiber fell from about USD 33/kg in 2022 to about USD 18/kg in 2025, and it valued China’s 2025 market at USD 2.64 billion. Sail also reports that Toray announced price increases at the end of 2025 after a year of low pricing. [S1]
The same filing separates production, shipments and closing inventory. Shipments exceeding output are consistent with the disclosed inventory reduction. That observation matters when reading a sales rebound: it can combine current manufacturing activity with release of previously produced material. It should not be translated directly into a new production rate. [S3]
The cost breakdown also shows why feedstock alone cannot explain the economics. In the company’s disclosed carbon-fiber cost of sales, manufacturing expenses are the largest bucket. Buyers assessing a low quotation should ask whether its durability comes from a repeatable process, energy and equipment performance, or a temporary inventory decision. A plant’s financial viability cannot be inferred from one raw-material index.
For the converter, the useful comparison is cost per accepted component: purchased fiber and resin, processing, inspection, scrap, rework, qualification and logistics divided by accepted output. A cheaper fiber that increases fuzz, tow breaks, impregnation defects or rejected laminates can raise the delivered-part cost. GetFRP recommends recording these outcomes during production-scale trials alongside the quoted price, with identical payment terms, packaging, delivery basis and product specification across competing bids.

↔ Scroll horizontally to see the full chart and data table.
Source: Shenying 2025 annual report, p. 29 [S3]. Production and shipments are annual flows; inventory is a year-end stock. They are displayed separately and must not be added.
View the chart data and evidence
| Series | Category | Value | Unit | Evidence / value basis | Reported range | Point note |
|---|---|---|---|---|---|---|
| — | 2025 production | 22488.86 | t | Company data | — | — |
| — | 2025 shipments | 25054.28 | t | Company data | — | — |
| — | Year-end inventory | 2680.52 | t | Company data | — | — |
↔ Scroll horizontally to see the full chart and data table.
- Manufacturing expenses51.15%
- Direct materials28.67%
- Direct labor19.28%
- Freight0.9%
Source: Shenying 2025 annual report, p. 29 [S3]. Percent of the company’s disclosed carbon-fiber cost of sales. This accounting breakdown is not an industry-wide process cost model.
View the chart data and evidence
| Series | Category | Value | Unit | Evidence / value basis | Reported range | Point note |
|---|---|---|---|---|---|---|
| — | Manufacturing expenses | 51.15 | % | Company data | — | — |
| — | Direct materials | 28.67 | % | Company data | — | — |
| — | Direct labor | 19.28 | % | Company data | — | — |
| — | Freight | 0.9 | % | Company data | — | — |
6. Technology: a fiber grade is the beginning of qualification
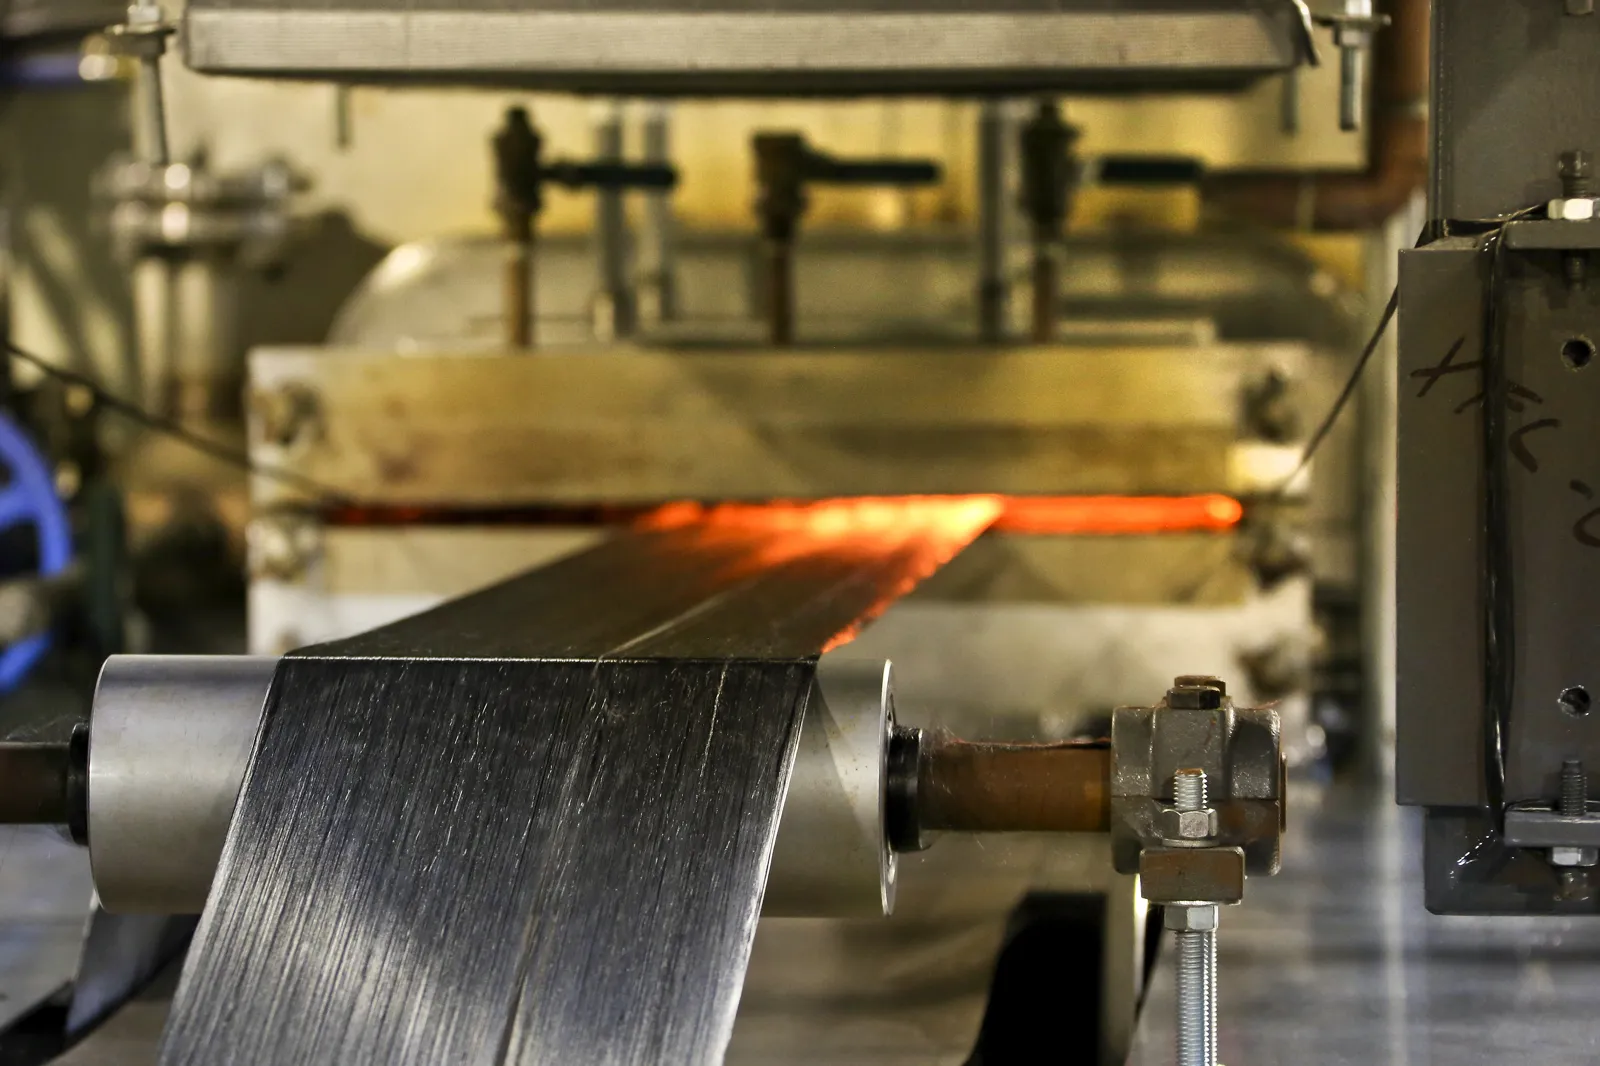
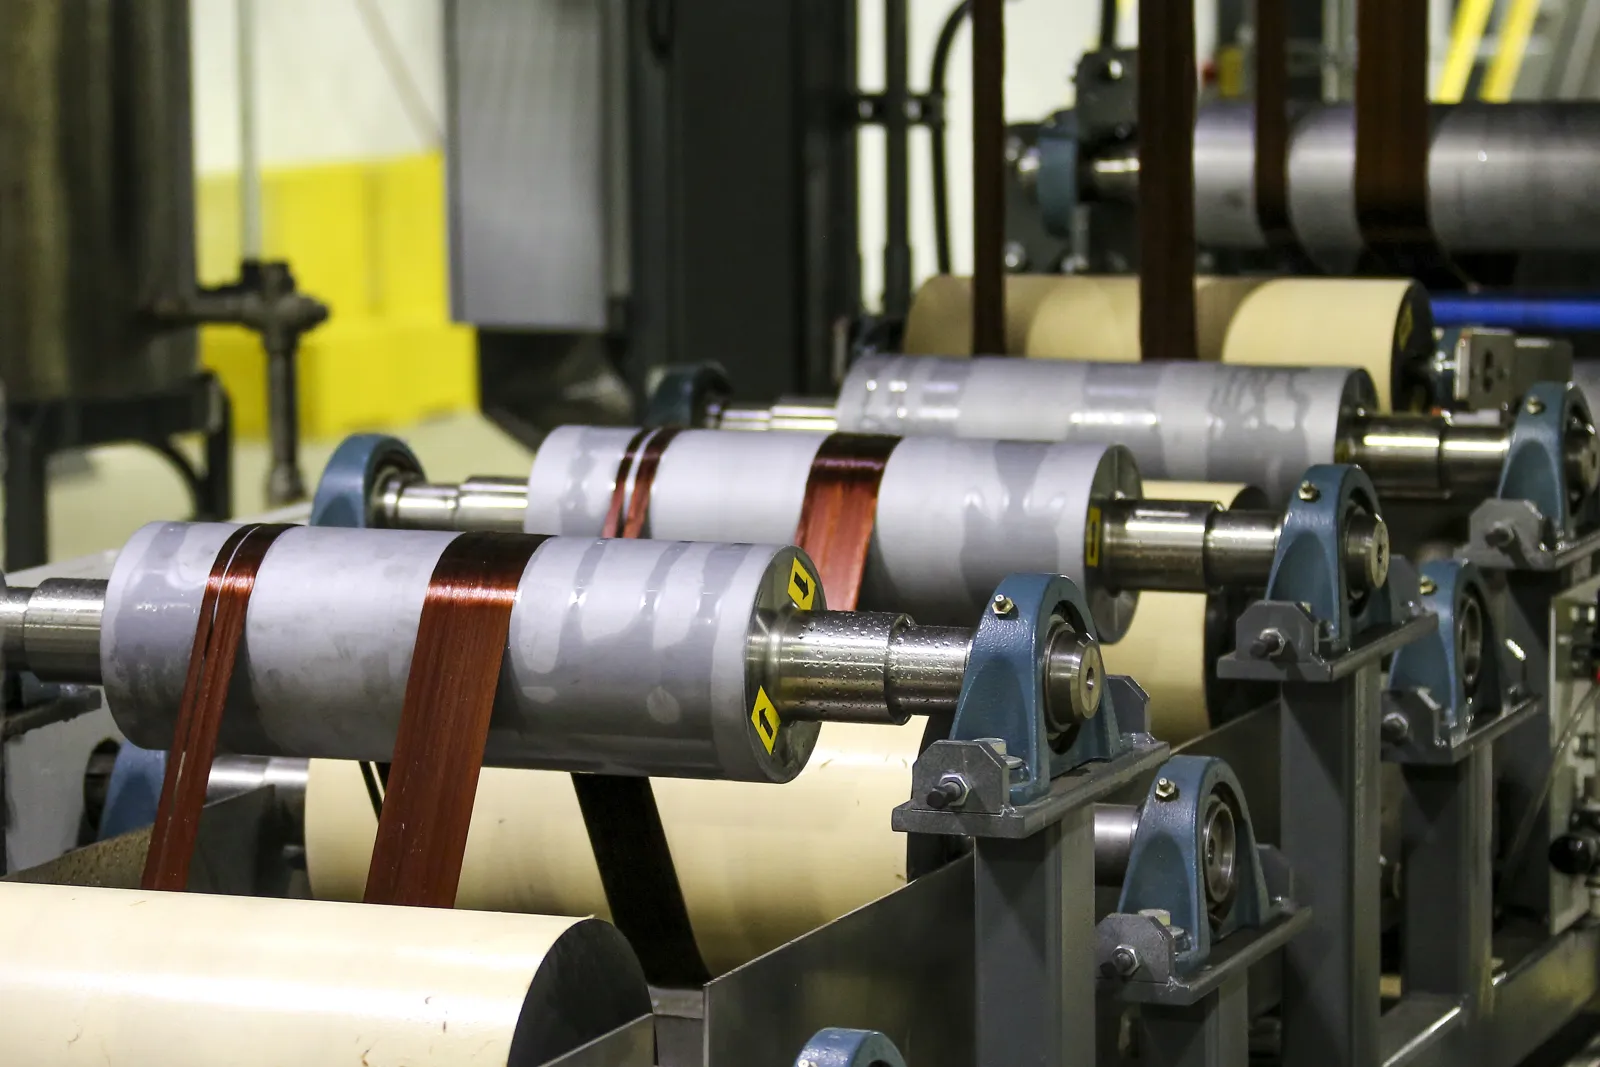
PAN-based carbon-fiber manufacturing links precursor preparation and spinning with stabilization, carbonization, surface treatment and sizing. Engineering performance depends on control across the chain and on how the resulting fiber behaves in a resin and forming process. Hexcel’s process description identifies the same sequence of oxidation, carbonization, surface treatment and sizing. [S10] The process illustration is intentionally qualitative: industrial recipes and operating windows are specific to each product and line. It should not be read as a manufacturing instruction or as the configuration of a named Chinese plant.
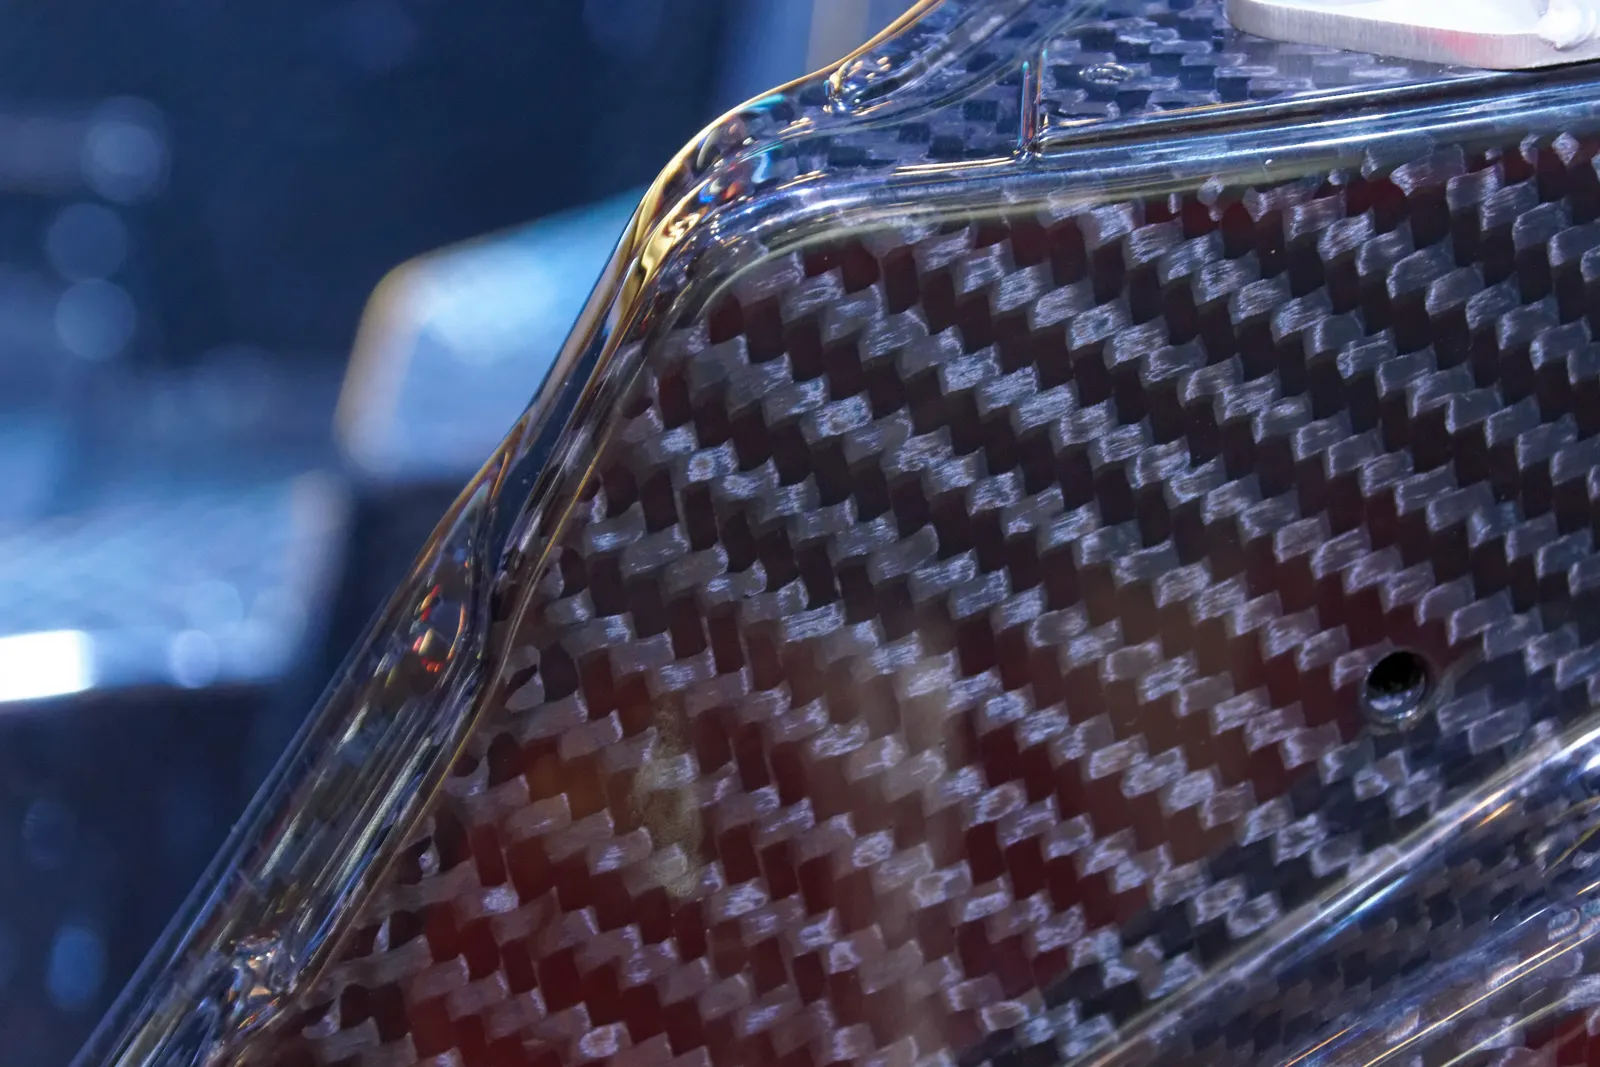
Tow size and performance grade answer different questions. A K designation describes the approximate number of filaments in a tow; it does not establish strength, modulus, sizing chemistry or laminate performance. Toray’s T700S datasheet, for example, identifies these attributes separately and reports typical fiber tensile strength of 4,900 MPa and modulus of 230 GPa. These are properties of that named product under its stated test method, not universal acceptance thresholds for every product marketed as T700-class. [S7]
Testing must also match the material level. ISO 10618:2004 addresses tensile properties of resin-impregnated carbon-fiber yarn. ASTM D3039/D3039M addresses in-plane tensile properties of polymer-matrix composite specimens and identifies preparation, conditioning, fiber volume and test environment among the relevant influences. A result from one level cannot simply replace a result from another. A tensile result alone also does not qualify a blade spar, vessel or aircraft structure for its full load and environmental requirements. [S8][S9]
GetFRP recommends a staged qualification: agree the fiber and resin specifications; establish process behavior on the intended equipment; test the resulting laminate; then verify the representative part and its production controls. Retain samples and lot records so an issue can be traced to fiber, resin, processing or storage. A purchasing agreement should state which changes require notification and reapproval, including a change of manufacturing location or sizing formulation.
This creates a commercial distinction between nominal specification matching and application approval. Toray’s industrial selector guide also distinguishes surface treatment from sizing and maps different sizings to resin families. That makes the interface a specific purchasing parameter, rather than an incidental coating. [S11] Suppliers can improve their market position through stable lot performance, documentation, technical support and process compatibility. For a converter, those capabilities reduce the uncertainty of moving from a laboratory coupon to repeated deliveries. They also make second-source qualification a planned engineering program rather than an emergency price negotiation.
↔ Scroll horizontally to see the full diagram.
| Evidence layer | Minimum question | Decision supported |
|---|---|---|
| Product identity | Exact grade, tow size, sizing, producer and site? | Whether the sample and purchased lot are the same material |
| Fiber testing | Method, conditioning, sampling and lot distribution? | Repeatability against the agreed fiber specification |
| Conversion trial | Behavior at the buyer’s target process conditions? | Whether the fiber is compatible with production |
| Composite testing | Resin, lay-up, fiber volume, cure and environment documented? | Whether the laminate meets application requirements |
| Part and supply controls | Part validation, traceability and change notification agreed? | Whether scale-up and repeat supply can be controlled |
Source: GetFRP qualification framework, informed by the distinct test scopes in ISO 10618 and ASTM D3039 [S8][S9].
7. 2026 evidence and outlook: watch conversion into repeat orders
Shenying’s unaudited interim filing reports first-half 2026 revenue of RMB 1.163 billion, up 26.14%, and attributable profit of RMB 70.16 million. Its carbon-fiber revenue and cost disclosures imply a product gross margin of approximately 21.3%, calculated as one minus cost divided by revenue. This provides a current company-level operating signal, while the national 2025 survey remains the market baseline. Neither a half-year result nor one producer’s recovery is sufficient to establish a national 2026 growth rate. [S4]
Third-quarter filings, published between 23 and 28 October 2026, cooled that signal. Shenying’s nine-month revenue rose 14.44% to RMB 1.759 billion, but third-quarter revenue fell 3.09% and quarterly attributable profit fell 27.35%, which the company attributes mainly to higher R&D expense. [S12] Guangwei’s nine-month revenue fell 2.39% and attributable profit fell 51.94%; its third-quarter profit was almost eliminated (−99.63%) as revenue from equipment-grade carbon fiber fell 31.60% and carbon-beam revenue fell 25.00%. [S13] Jilin Carbon Valley grew nine-month revenue 24.14%, yet its third-quarter attributable profit fell 81.96%. [S14] Across three listed producers, the same quarter combined continued volume growth in some lines with sharply lower profit, which is the pattern the downside scenario below describes.
GetFRP’s outlook is conditional. A stronger expansion case requires qualified industrial applications to turn into repeat orders while new lines achieve stable accepted output. A more cautious case has successful material demonstrations but slower customer approvals, product launches or inventory normalization. A downside case combines new capacity with delayed conversion programs and price competition. These are decision scenarios, not assigned probabilities or a numerical market-size forecast.
The most informative indicators are shipment mix, customer-approved output, inventory, cash collection and the spread between fiber realization and cost. Track these by segment where possible. A rise in shipments alongside lower inventory can be constructive, but sustainable growth also needs customers to reorder. For high-performance applications, the movement from samples to approved specifications and serial parts is a better leading indicator than a laboratory strength announcement alone.
↔ Scroll horizontally to see the full chart and data table.
Source: Shenying 2026 interim report, p. 7 [S4]; Q3 2026 report, pp. 1 and 10 [S12]. Unaudited consolidated company revenue. Q3 2025 is a GetFRP calculation: nine-month 2025 revenue (RMB 1,536.9 million) minus H1 2025 revenue (RMB 921.6 million). This is not China’s market revenue and is not a full-year forecast.
View the chart data and evidence
| Series | Category | Value | Unit | Evidence / value basis | Reported range | Point note |
|---|---|---|---|---|---|---|
| — | H1 2025 | 921.6179 | RMB million | Company data | — | — |
| — | H1 2026 | 1162.5003 | RMB million | Company data | — | — |
| — | Q3 2025 | 615.3081 | RMB million | Company data | — | — |
| — | Q3 2026 | 596.3061 | RMB million | Company data | — | — |
| Scenario | Observable signal | Commercial response |
|---|---|---|
| Faster qualified growth | Repeat industrial orders; stable accepted yield; improving cash collection | Reserve approved grades and define scalable delivery schedules |
| Uneven conversion | More trials and approvals, but serial orders lag | Stage commitments against qualification milestones |
| Capacity and pricing pressure | Inventory rises; discounting widens; project commissioning outpaces orders | Review supplier continuity, working capital and second-source readiness |
Source: GetFRP analytical scenarios. No probability, price target or national forecast is implied.
8. Sourcing priorities and research methodology
For international buyers, the practical opportunity is a broader Chinese supply base with more ways to combine fiber production and downstream conversion. Start with a defined application and a documented incumbent material, then shortlist producers that can supply the exact format and cooperate on validation. An RFQ should contain annual and initial quantities, testing expectations, packaging, delivery location, payment terms and the required change-control process. Compare the full delivery proposition after technical screening.
For Chinese manufacturers and converters, the commercial challenge is to turn available fiber into a qualified material system with measurable customer value. A useful offer explains how the grade improves accepted output, process stability, component performance or delivery reliability. Supporting evidence should be specific to the offered product and process; broad corporate capacity and impressive test peaks cannot replace that evidence.
The original research cut-off was 24 October 2026; third-quarter 2026 company filings published up to 28 October were added at a fact-check on 3 November 2026. National quantities come from Sail’s 2025 survey, with its methodology and limitations retained. Company evidence comes from published annual, interim and quarterly filings; later-period figures are kept separate from the annual market baseline. Provincial government articles are used for explicitly scoped group disclosures. Technical references are official manufacturer data and standards-publisher scope pages. Charts reproduce cited inputs or disclose a simple calculation. Source dates, physical units, legal-entity boundaries and the distinction between observations and GetFRP interpretation determine inclusion.
The supplier links lead to existing GetFRP profiles and the manufacturers’ official websites. Their inclusion supports further investigation and does not certify that a company or product is approved for a particular project. This report does not assign supplier quality scores, infer secret capacity, or estimate national fiber revenue from a blended company realization.
Frequently asked questions
How large is China’s carbon fiber market?
Sail’s 2025 survey estimates 132,027 tonnes of demand, versus 84,062 tonnes in 2024. The measure is based on domestic supplier sales plus imports and is not an official final-consumption census or a market-revenue estimate.
How much carbon fiber capacity does China have?
The 2025 survey reports 171,080 tonnes per year of operating capacity, representing 52.5% of the global total. Planned projects, actual production and customer-qualified output are separate measures.
What share of China’s carbon fiber supply is domestic?
The survey reports domestic supply of 113,400 tonnes and imports of 18,627 tonnes in 2025, giving a domestic share of 85.9%. This does not mean every grade is qualified as a substitute for imported material.
What does carbon fiber cost in China?
There is no single representative price without a grade, tow size, sizing, volume and delivery basis. Shenying’s 2025 carbon-fiber revenue divided by shipments gives about RMB 86.6/kg, a historical blended company realization rather than a current quotation or a T700 benchmark. Sail’s survey puts the average price of China-supplied fiber at about USD 18/kg in 2025, down from about USD 33/kg in 2022.
Is T700-class fiber interchangeable between manufacturers?
No automatic interchangeability follows from the label. Confirm exact fiber properties, sizing, manufacturing site, resin compatibility, conversion performance and the customer’s qualification requirements before substitution.
How did Chinese carbon fiber producers perform in 2026?
Mixed. In January–September 2026 Zhongfu Shenying’s revenue rose 14.44% and Jilin Carbon Valley’s 24.14%, while Guangwei’s fell 2.39%. In the third quarter all three reported lower attributable profit than a year earlier: −27.35%, −81.96% and −99.63% respectively.
Which Chinese carbon fiber suppliers should a buyer investigate?
This report examines Jilin Chemical Fiber Group, Zhongfu Shenying and Guangwei, and links the existing GetFRP profile for Sinopec Shanghai Petrochemical. The shortlist should be refined by the exact application, grade, format, qualification status and supplying plant.
Sources and scope
Figures were cross-checked against primary documents where available; secondary citations are marked in each scope note. Company figures are reported as disclosed by the companies themselves. This note is an independent market assessment and not investment advice.
- [S1]Sail — 2025 Global Carbon Fiber Composites Market Report
Original industry research reproduced by China Composites Expo; sections 2, 3 and 5. Survey estimates of demand, supply and operating capacity; methodology explicitly uses supplier sales plus imports.
- [S2]Weihai Guangwei Composites — 2025 annual report
Published 31 March 2026. Printed p. 7: consolidated financial results; p. 14: Sail market figures. Company evidence and attribution of survey data are kept distinct.
- [S3]Zhongfu Shenying — 2025 annual report
Published 26 March 2026. Printed pp. 28–29: carbon-fiber revenue, gross margin, production, shipments, year-end inventory and cost composition. RMB/kg calculation uses product revenue and disclosed shipments.
- [S4]Zhongfu Shenying — 2026 interim report
Published 27 August 2026; unaudited. Printed p. 7: comparable H1 financial results; pp. 10–12: product and application discussion; p. 14: existing and available capacity; p. 149: product revenue and cost supporting the calculated gross margin.
- [S5]Jilin provincial government — group carbon-fiber sales and capacity
22 January 2026. Reports 2025 Jilin Chemical Fiber Group sales of 56,000 tonnes and carbon-fiber capacity of 70,000 tonnes per year; group scope, not a single listed entity.
- [S6]Jilin provincial government — subsequent group capacity disclosure
27 April 2026. Reports 74,000 tonnes per year and repeats 56,000 tonnes of sales for 2025. The difference from the January capacity disclosure remains unreconciled.
- [S7]Toray Composite Materials America — T700S datasheet
Manufacturer’s product-specific typical properties and identification of tow, sizing and surface treatment. Not a generic specification for all T700-class products.
- [S8]ISO 10618:2004 — carbon-fiber impregnated-yarn tensile testing
Official standards-publisher scope; resin-impregnated yarn tensile properties. Scope checked at research cut-off.
- [S9]ASTM D3039/D3039M-17(2025) — composite tensile properties
Official standards-publisher scope and significance. Composite specimen testing and reporting influences; not an automatic component qualification.
- [S10]Hexcel — HexTow continuous carbon fiber manufacturing
Manufacturer explanation of the PAN conversion, oxidation, carbonization, surface-treatment and sizing sequence. Used for the qualitative process schematic only.
- [S11]Toray — Industrial Selector Guide
Manufacturer technical guide: surface-treatment and sizing functions and resin compatibility. Technical background, not a specification for a Chinese grade.
- [S12]Zhongfu Shenying — 2026 third-quarter report
Published 23 October 2026; unaudited. P. 1: Q3 and January–September revenue and profit with year-on-year changes; p. 4: reasons for changes; p. 10: consolidated income statement with comparable nine-month 2025 revenue.
- [S13]Weihai Guangwei Composites — 2026 third-quarter report
Published 27 October 2026; unaudited. P. 2: Q3 and January–September revenue and profit; p. 5: segment revenue and the decline in equipment-grade fiber and carbon-beam revenue.
- [S14]Jilin Carbon Valley Carbon Fiber — 2026 third-quarter report
Published 28 October 2026; unaudited. P. 3: Q3 and January–September revenue and attributable profit with year-on-year changes.
Image provenance and usage terms appear in each caption; see image credits. Submit a source correction.





