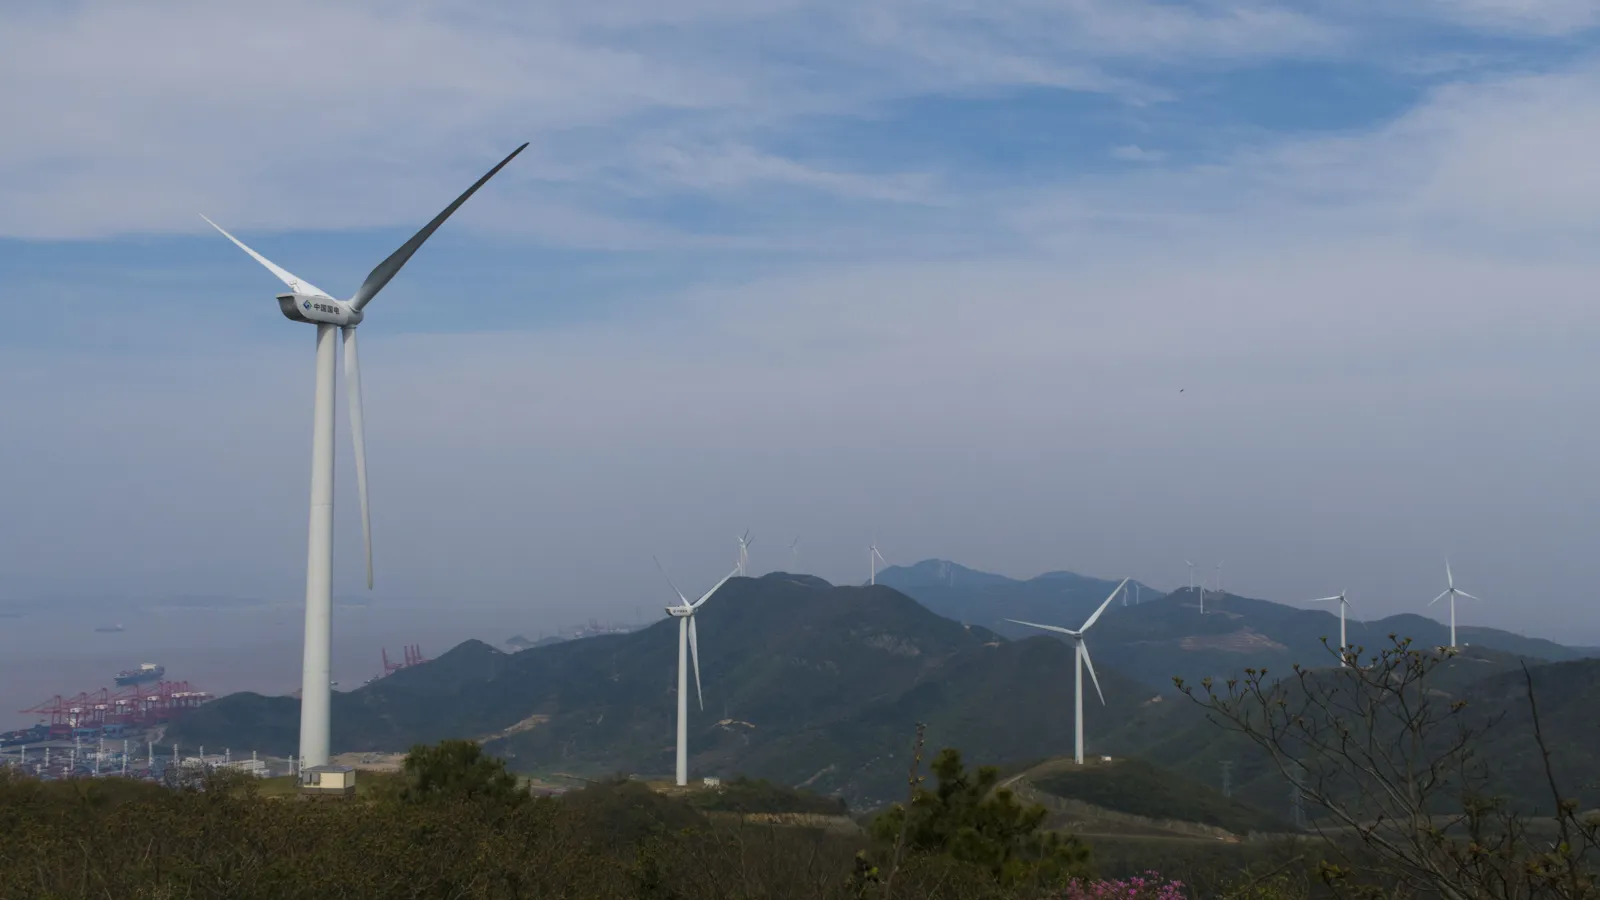
1. China wind power market size: measure the physical market first
China’s wind market entered 2026 with a much larger operating asset base, but the pace of new construction is uneven. NEA reported 120 GW of new wind capacity, up 51%, and about 640 GW connected by the end of 2025 (590 GW onshore, 47 GW offshore). Annual wind generation reached 1,130 TWh, while reported wind utilization was 94%. These are national electricity-system statistics, not turbine factory shipments or composite-material purchases. [S1] GWEC’s Global Wind Report 2026 counts 120.5 GW for China out of a record 165 GW connected worldwide in 2025 and 1,299 GW of global wind capacity, so China’s build rate largely sets the global blade-material cycle. [S18]
The economic significance lies in two distinct customer pools. New projects buy turbines, blades and construction services; the installed fleet creates recurring inspection, repair and replacement work. A materials supplier should therefore separate new-build blade programs from repair consumables, retrofit components and wind-farm infrastructure. Combining them into one revenue estimate obscures different qualification cycles and different buyers.
This report uses physical deployment as its principal market-size measure. A defensible national revenue total would need consistent coverage of turbine equipment, balance of plant, offshore foundations, transmission, development and services, while eliminating intermediate sales. Multiplying capacity by an unsourced average turbine price would leave those boundaries unresolved. Company financials later in the report show commercial scale without being presented as a national total.
↔ Scroll horizontally to see the full chart and data table.
Source: NEA [S1] [S2]. Full calendar years only. The 2025 release rounds additions to 120 GW; decimals on the axis do not imply extra source precision.
View the chart data and evidence
| Series | Category | Value | Unit | Evidence / value basis | Reported range | Point note |
|---|---|---|---|---|---|---|
| — | 2024 | 79.82 | GW | Statistic | — | — |
| — | 2025 | 120 | GW | Statistic | — | — |
| Measure | What it represents | Correct commercial use |
|---|---|---|
| New grid connections | Capacity entering the electricity system | Deployment demand and commissioning pace |
| CWEA installations / hoisting | Turbines installed under the association’s methodology | OEM position and equipment installation mix |
| Company MW sales | A supplier’s own reported deliveries or recognized sales | Company performance within its stated perimeter |
| GW of blade sales | Blade sets expressed as associated turbine power | Blade supplier activity; not blade mass |
| TWh generation | Electrical energy produced over a period | Operating performance and electricity demand |
| Material tonnes | Mass ordered or consumed for identified programs | Fiber/resin procurement after bill-of-materials validation |
2. China wind installations in 2026: compare matching periods before judging growth
The first half of 2026 looked weak against the 2025 rush. New connections fell from 51.39 GW in H1 2025 to 38.62 GW in H1 2026, a GetFRP calculation of −24.85%, and reported utilization slipped from 93.2% to 90.9%. [S3] [S4] The third quarter changed the picture. NEA’s January–September release reports 60.66 GW of new wind connections (58.21 GW onshore, 2.45 GW offshore), against 61.09 GW in the same nine months of 2025, a GetFRP calculation of −0.70%. Subtracting the half-year totals gives about 22.0 GW connected in Q3 2026 versus 9.7 GW in Q3 2025, both GetFRP calculations from the same NEA series. [S5] [S17]
At the end of September 2026 grid-connected wind capacity stood at 700 GW, up 20.4% year on year, of which 650 GW onshore and 49.84 GW offshore. Wind generation in January–September reached 855.4 TWh against 813.7 TWh a year earlier (+5.12%, GetFRP calculation), while utilization fell from 94.0% to 92.1%. Year-on-year capacity growth was about four times generation growth, which is why curtailment and offtake now weigh on developers’ purchasing decisions. Year-to-date totals should not be annualized mechanically: in 2025 roughly 59 GW, almost half of the year’s 120 GW, was connected in the fourth quarter (GetFRP calculation, 120 − 61.09 GW). [S1] [S5] [S17]
For procurement planning, a lower commissioning total does not map one-for-one onto a lower factory workload. Materials are purchased before blade manufacture, blades may wait for transport and installation, and commissioned turbines may use components delivered in the prior period. A useful order forecast needs project-level manufacturing slots, acceptance milestones and inventory movements. It should also distinguish a customer’s firm call-off from a framework agreement with optional volumes.
Utilization is not capacity factor
The reported renewable utilization rate concerns energy utilization/curtailment. It is not the fraction of all hours spent operating at rated power. Calculating generation ÷ year-end capacity ÷ hours also biases a rapidly expanding fleet because new capacity was not available for the whole period.
↔ Scroll horizontally to see the full chart and data table.
Source: NEA [S3] [S4] [S5] [S17]. Cumulative year-to-date totals, not quarters. H1 −24.85% and Jan–Sep −0.70% calculated from the published totals.
View the chart data and evidence
| Series | Category | Value | Unit | Evidence / value basis | Reported range | Point note |
|---|---|---|---|---|---|---|
| — | H1 2025 | 51.39 | GW | Statistic | — | — |
| — | H1 2026 | 38.62 | GW | Statistic | — | — |
| — | Jan–Sep 2025 | 61.09 | GW | Statistic | — | — |
| — | Jan–Sep 2026 | 60.66 | GW | Statistic | — | — |
↔ Scroll horizontally to see the full chart and data table.
Source: NEA [S5] [S17]. Energy, not installed power. +5.12% calculated; weather, commissioning timing and grid conditions all matter. H1 figures were 588.0 and 598.4 TWh [S3] [S4].
View the chart data and evidence
| Series | Category | Value | Unit | Evidence / value basis | Reported range | Point note |
|---|---|---|---|---|---|---|
| — | Jan–Sep 2025 | 813.7 | TWh | Statistic | — | — |
| — | Jan–Sep 2026 | 855.4 | TWh | Statistic | — | — |
| Indicator | H1 2025 | H1 2026 | Jan–Sep 2025 | Jan–Sep 2026 |
|---|---|---|---|---|
| New grid connections, total | 51.39 GW | 38.62 GW | 61.09 GW | 60.66 GW |
| Onshore new grid connections | 48.90 GW | 37.78 GW | 57.59 GW | 58.21 GW |
| Offshore new grid connections | 2.49 GW | 0.84 GW | 3.50 GW | 2.45 GW |
| Cumulative capacity at period end | 573 GW | 679 GW | 582 GW | 700 GW |
| Wind generation | 588.0 TWh | 598.4 TWh | 813.7 TWh | 855.4 TWh |
| Reported wind utilization (not capacity factor) | 93.2% | 90.9% | 94.0% | 92.1% |
Source: NEA [S4] (H1 2025), [S3] (H1 2026), [S17] (Jan–Sep 2025), [S5] (Jan–Sep 2026); 10,000 kW converted to GW and 100 million kWh to TWh.
3. Onshore and offshore wind are different addressable markets
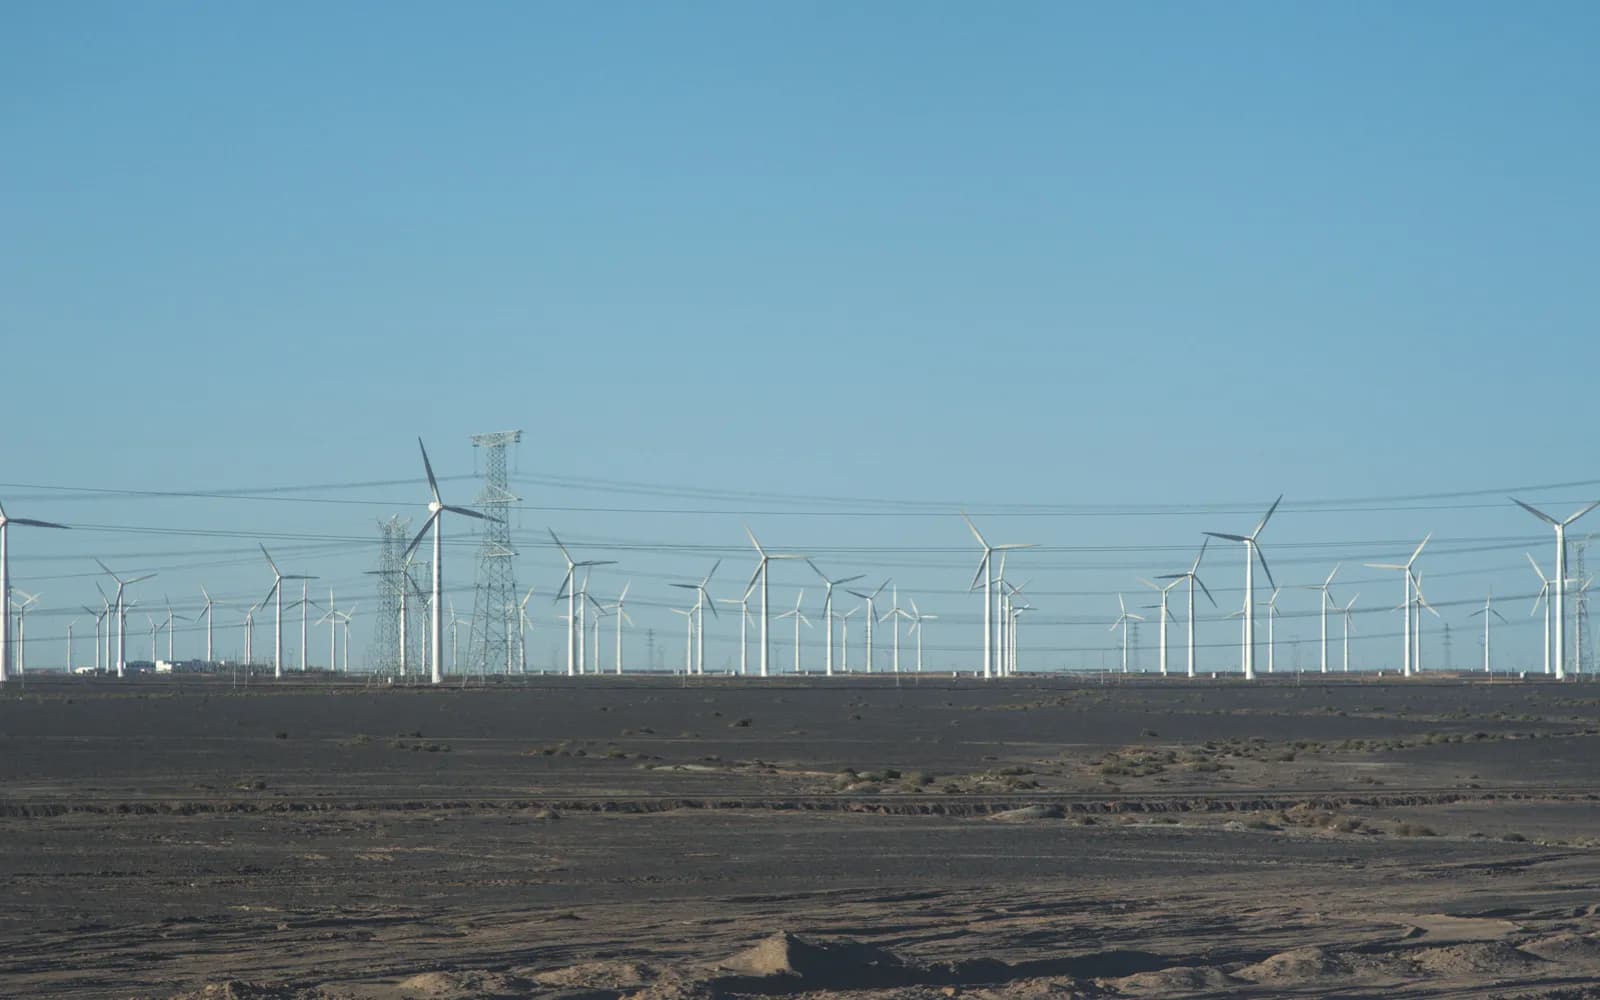
Onshore dominates the deployment base. NEA’s rounded 2025 release reports 110 GW of new onshore capacity and 6.59 GW offshore, with the northern, northeastern and northwestern regions accounting for 79% of total new wind installations. Because the headline and segment figures are rounded differently, they should not be forced to reconcile by manufacturing an unreported remainder. [S1]
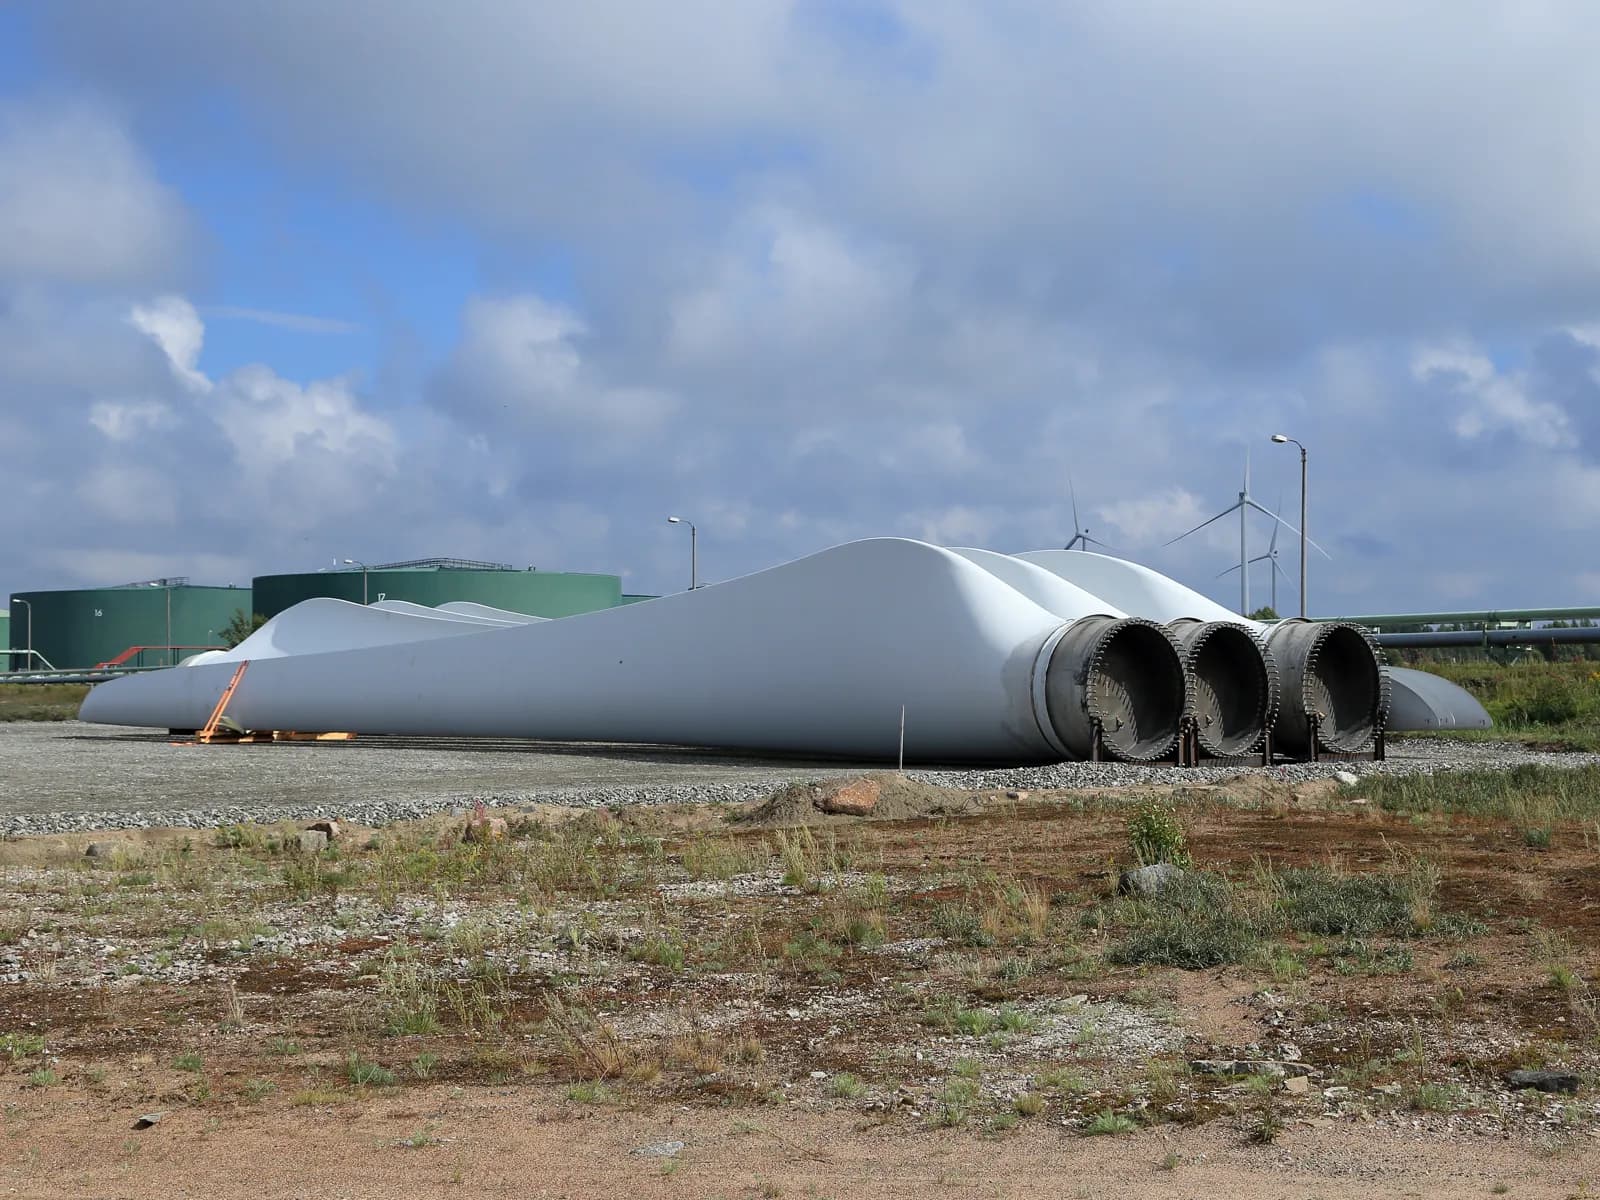
For onshore blade and material suppliers, the practical segmentation is by turbine platform, climate, logistics route and production plant. Desert and cold-region projects create different surface-protection, processing and handling needs from humid low-wind-speed sites. A large rotor that improves energy capture can increase the difficulty of road transport and lifting. The technically attractive material is the one that survives the complete project chain at an acceptable delivered cost.
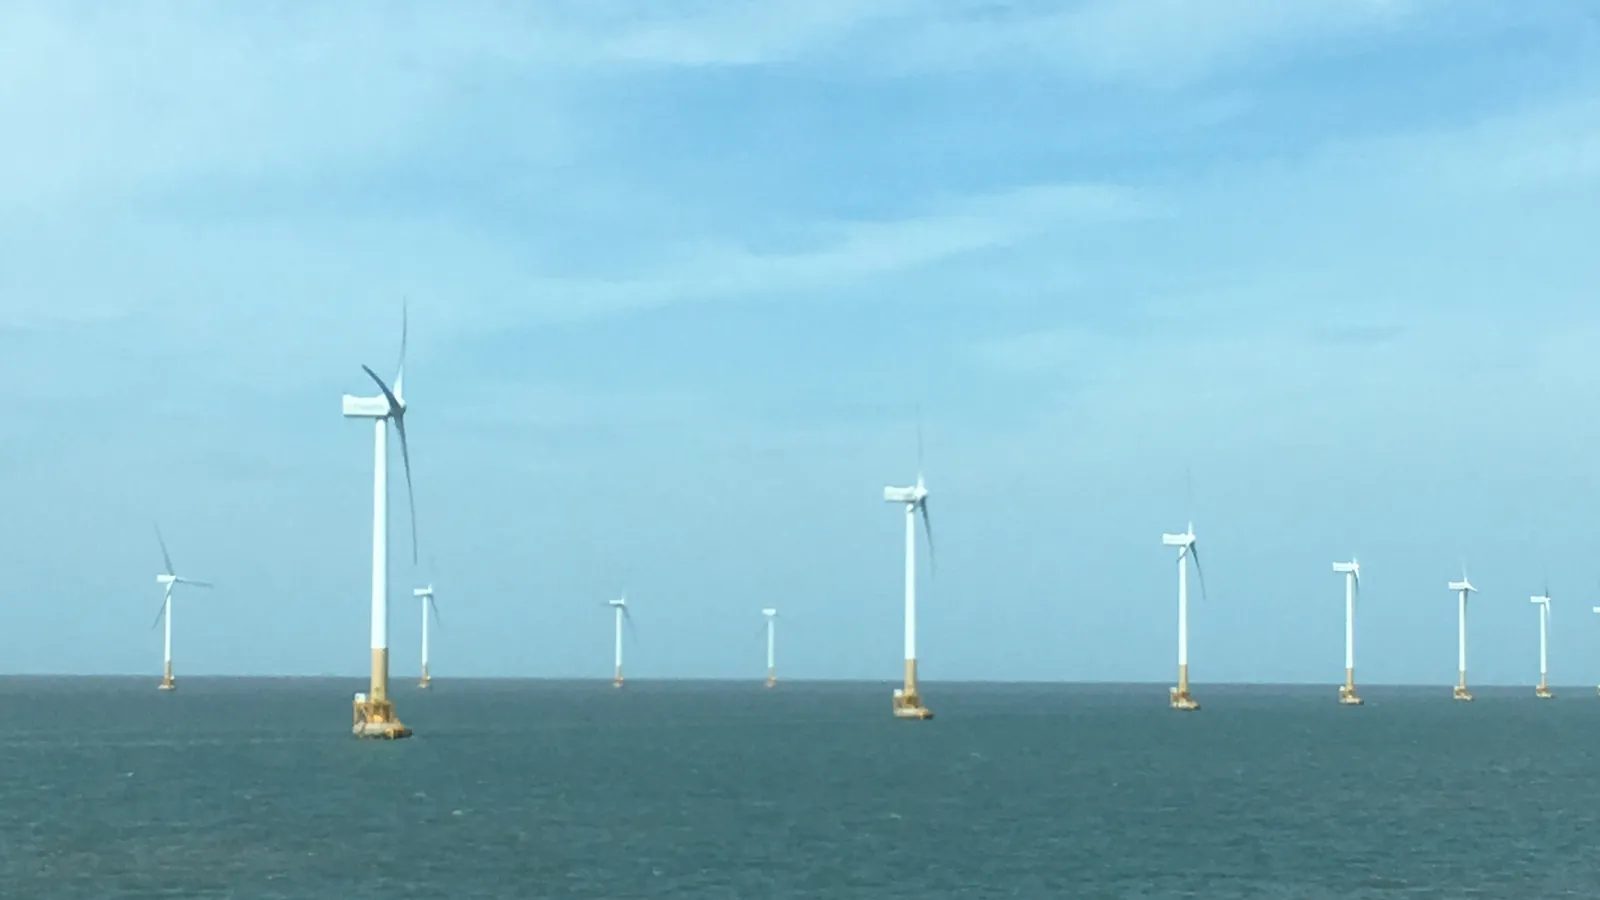
Offshore business has a different schedule and risk profile. Marine installation windows, ports, vessels, foundations and grid landing infrastructure can become critical even when blades are ready. Salt exposure, rain erosion, lightning and access costs make reliability and repairability especially valuable. A supplier should qualify the exact offshore blade design and factory, rather than infer suitability from the material’s success on an onshore platform.
For market entry, a buyer map is more actionable than a national provincial league table alone. Follow the developer’s turbine award to its OEM, blade design owner, manufacturing site, approved material list and expected production date. The developer may set performance requirements without being the direct purchaser of glass fabric or spar-cap plate. Local delivery arrangements can matter as much as the headquarters location.
4. Chinese wind turbine manufacturers: concentration and platform scale
The market is concentrated enough that platform access matters. CWEA’s 2025 installation data, reproduced in Shanghai Electric Wind Power’s filing, put Goldwind, Windey, Mingyang, Envision and Sany at the top of the domestic ranking. The table totals 130.82 GW on an installation basis. It is a separate series from NEA’s roughly 120 GW of new grid-connected capacity. The difference is not a measure of unsold inventory. [S7]
The association’s fuller brief, republished by the China Wind Energy Equipment Association (CWEEA) in March 2026, counts 18,272 turbines and about 130 GW installed in 2025 (+49.9%), of which 5.603 GW offshore, against NEA’s 6.59 GW of offshore grid connections. The top five OEMs took 73.4% of new installations and the top seven each exceeded 10 GW. Newly installed turbines averaged 7.160 MW, with 7.068 MW onshore and 10.095 MW offshore, and exports reached 7.734 GW. Exports are a distinct market channel; adding them to domestic connection statistics would mix definitions and timing. [S1] [S6]
For a new composite supplier, concentration has two consequences. A successful qualification can open a meaningful recurring program, but failure of a single account or platform transition can remove a large share of expected demand. Technical development and commercial diversification should proceed together: qualify a second manufacturing site or compatible program while retaining control of formulation, sizing and process changes.
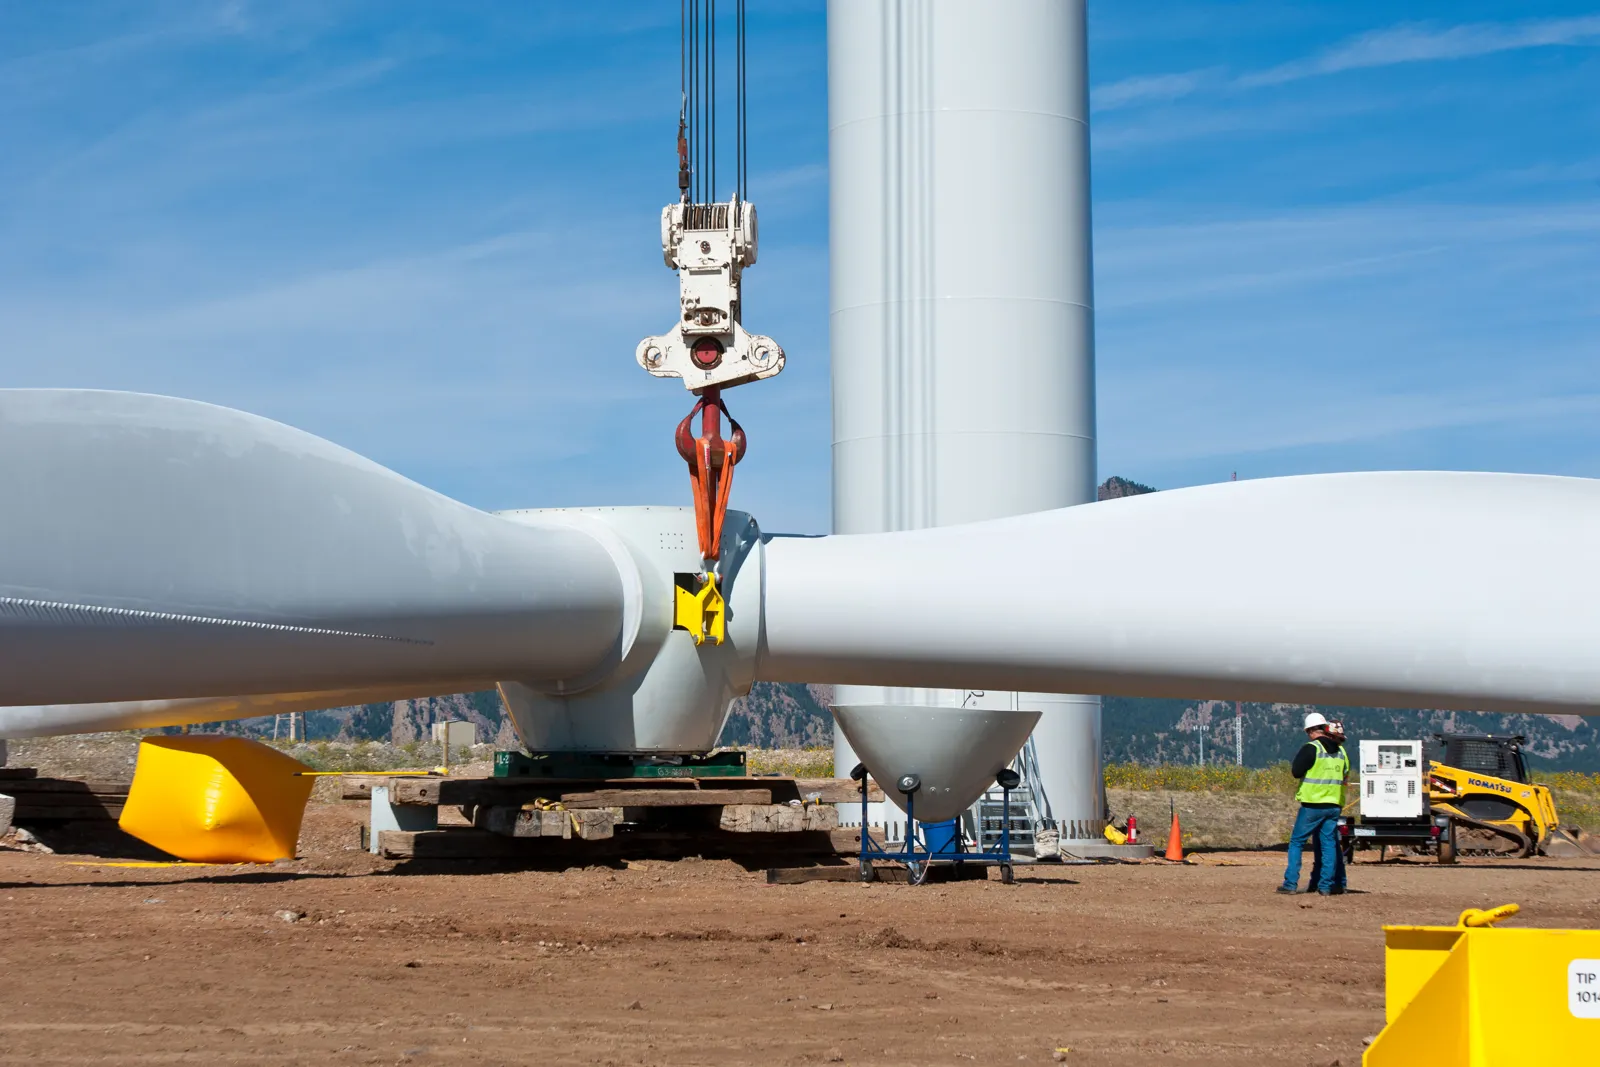
↔ Scroll horizontally to see the full chart and data table.
Source: CWEA reproduced in Shanghai Electric Wind Power 2025 annual report, p.15 [S7]. Source values retained. Rounded company rows sum to 130.82 GW; domestic installation/hoisting, not grid connections, sales or exports.
View the chart data and evidence
| Series | Category | Value | Unit | Evidence / value basis | Reported range | Point note |
|---|---|---|---|---|---|---|
| — | Goldwind | 25.9 | GW | Company data | — | — |
| — | Windey | 19.24 | GW | Company data | — | — |
| — | Mingyang | 18.55 | GW | Company data | — | — |
| — | Envision | 17.58 | GW | Company data | — | — |
| — | Sany | 14.71 | GW | Company data | — | — |
| — | CRRC | 12.27 | GW | Company data | — | — |
| — | Dongfang Electric | 11.87 | GW | Company data | — | — |
| — | Shanghai Electric | 6.46 | GW | Company data | — | — |
| — | CSSC Haizhuang | 4.04 | GW | Company data | — | — |
| — | Sinovel | 0.2 | GW | Company data | — | — |
5. Company economics: scale does not guarantee a high-margin order
Goldwind’s 2025 accounts report RMB 73.02 billion of consolidated revenue. Its turbine-and-component business generated RMB 57.21 billion with an 8.95% gross margin; turbine sales were 27.73 GW across the company’s business perimeter. Sinoma Science & Technology reported RMB 12.59 billion of wind-blade product revenue and 36.18 GW of blade sales. These figures describe different stages of a supply chain and must not be added into a China wind market total. [S8] [S9]
Interim 2026 filings show the two stages diverging. Goldwind’s external turbine sales rose 16.19% to 12.36 GW in H1 2026 and its turbine-and-component gross margin improved to 11.62%, up 3.65 percentage points. Sinoma’s blade sales grew only 2% to 15.5 GW, and its blade gross margin fell 4.38 points to 12.00%. Sinoma’s filing describes stable turbine bid prices but rising raw-material costs, and states that blade-industry capacity still exceeds demand, with some new capacity due in the second half. For a fabric, resin or spar-cap supplier, that is a buyer’s market at the blade plant even while turbine OEM margins recover. [S19] [S20]
The financial lesson for a material supplier is that downstream volume alone is insufficient evidence of pricing power. A contract can grow revenue while increasing the cash tied up in stock, approval batches, credit terms and warranty exposure. Compare contribution after transport, packaging, quality inspection, process support and expected nonconformance costs. For long blades, a rejected or late material batch can affect far more value than the purchase price of the material itself.
China’s electricity-pricing reform also changes the customer’s investment arithmetic. The NDRC/NEA explanation of Document 136 distinguishes projects commissioned before 1 June 2025 from later projects and sets a market-based mechanism for determining the mechanism price of new projects. Provincial implementation and project eligibility must be checked individually. For suppliers, the analytical implication is to focus on delivered energy, reliability and bankable project schedules rather than assuming that every announced GW becomes a purchase order. [S10]
An RFQ should therefore separate the unit price from its commercial perimeter: currency, tax, Incoterm and named destination, moisture-protective packaging, minimum batch, shelf life, transport conditions, payment milestones, rejection handling and price-adjustment rules. This report does not present a single “China wind blade material price”; grade, qualification, order scale and delivery scope make such a number misleading without matched quotations.
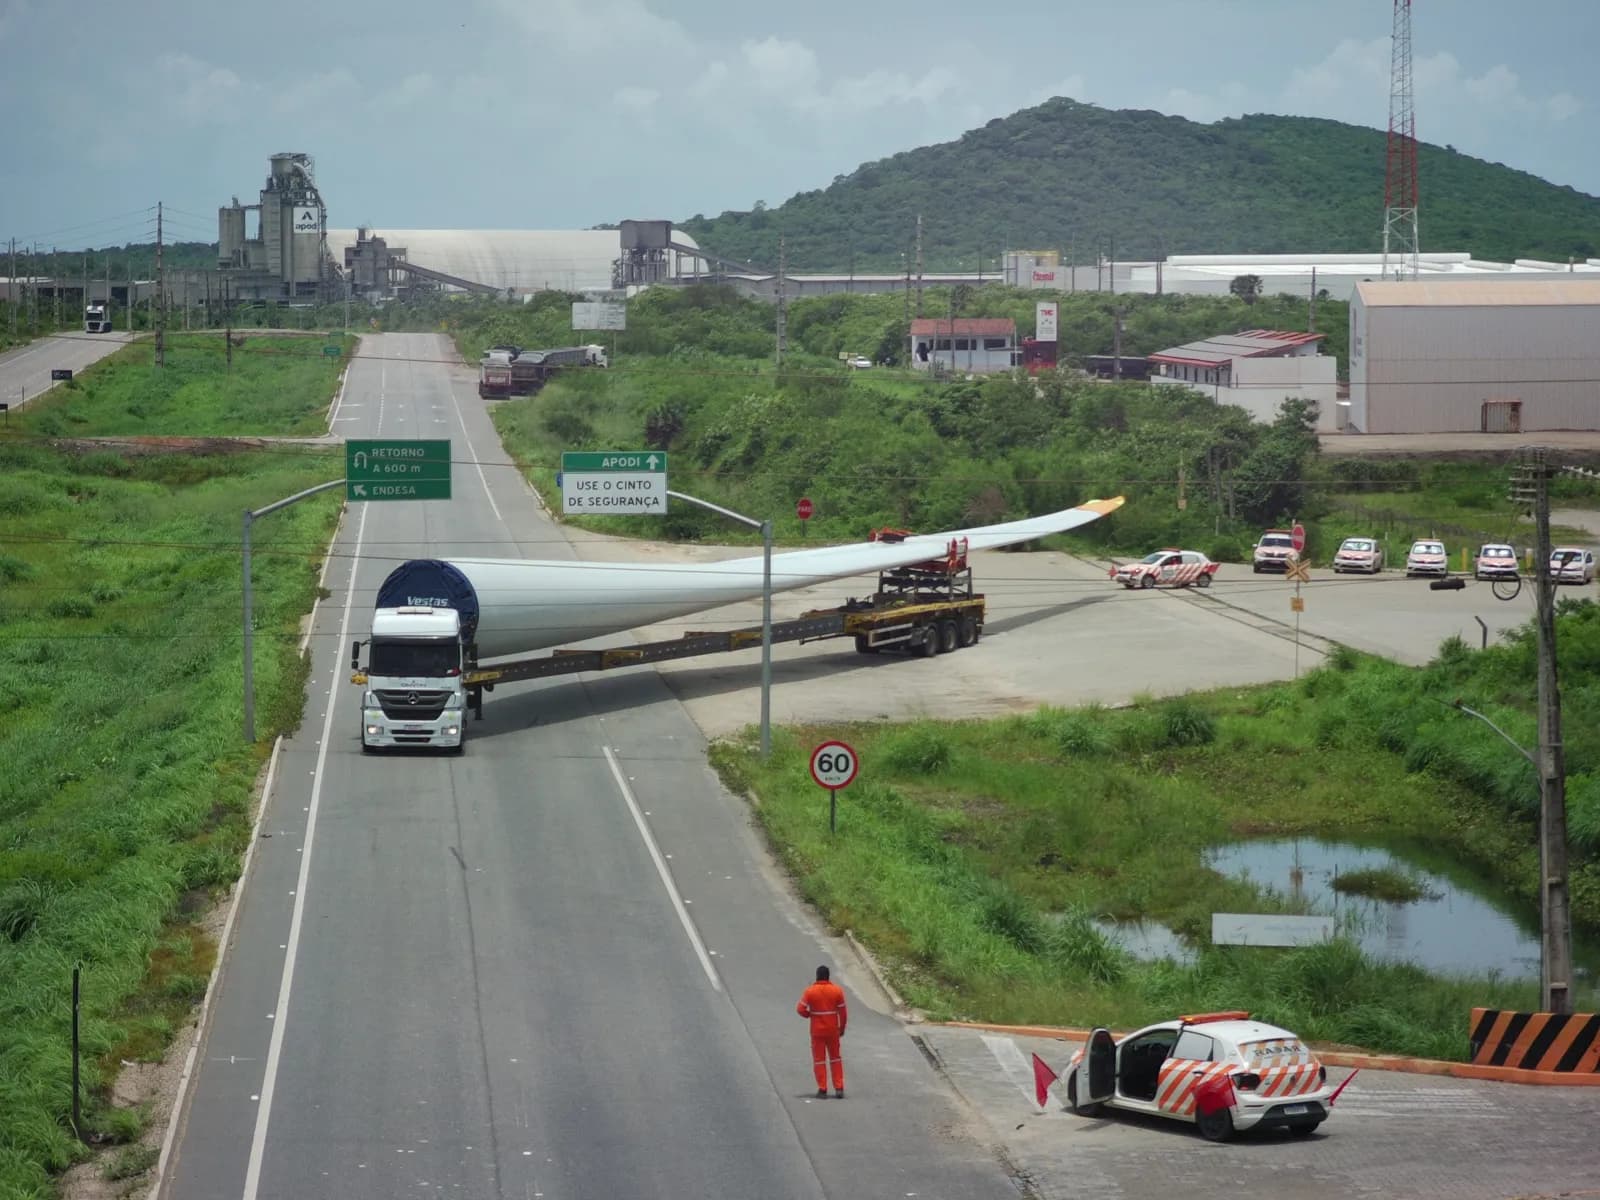
↔ Scroll horizontally to see the full chart and data table.
Source: Sinoma Science & Technology 2025 annual report, p.20 [S9]. Blade sales expressed as associated turbine capacity. Includes the company’s stated business perimeter; not China installations or composite tonnage.
View the chart data and evidence
| Series | Category | Value | Unit | Evidence / value basis | Reported range | Point note |
|---|---|---|---|---|---|---|
| — | 2024 | 23.996 | GW | Company data | — | — |
| — | 2025 | 36.18 | GW | Company data | — | — |
| Entity / measure | Value | Scope control |
|---|---|---|
| Goldwind turbine and component gross margin, 2025 | 8.95% | Product segment, not net margin or supplier margin |
| Goldwind turbine production, 2025 | 29.357 GW | Company production; distinct from 27.727 GW sales |
| Goldwind year-end turbine inventory, 2025 | 5.137 GW | Company stock; not unconnected national capacity |
| Sinoma wind-blade product gross margin, 2025 | 14.18% | Product reporting line; not the whole group |
| Goldwind turbine and component gross margin, H1 2026 | 11.62% | Unaudited interim; +3.65 points year on year |
| Goldwind external turbine sales, H1 2026 | 12.364 GW | External-sales basis; not comparable with the 27.727 GW annual sales-volume line |
| Sinoma wind-blade sales, H1 2026 | 15.5 GW | +2% year on year; blade gross margin 12.00% |
| Sinoma wind-blade production, 2025 | 37.919 GW | Company output; distinct from 36.180 GW sales |
Source: Goldwind p.23 [S8] and H1 2026 pp.12, 20 [S19]; Sinoma pp.19–20 [S9] and H1 2026 pp.9, 15 [S20]. Values converted from MW to GW and rounded.
6. Wind turbine blade materials: where glass, carbon and resin compete
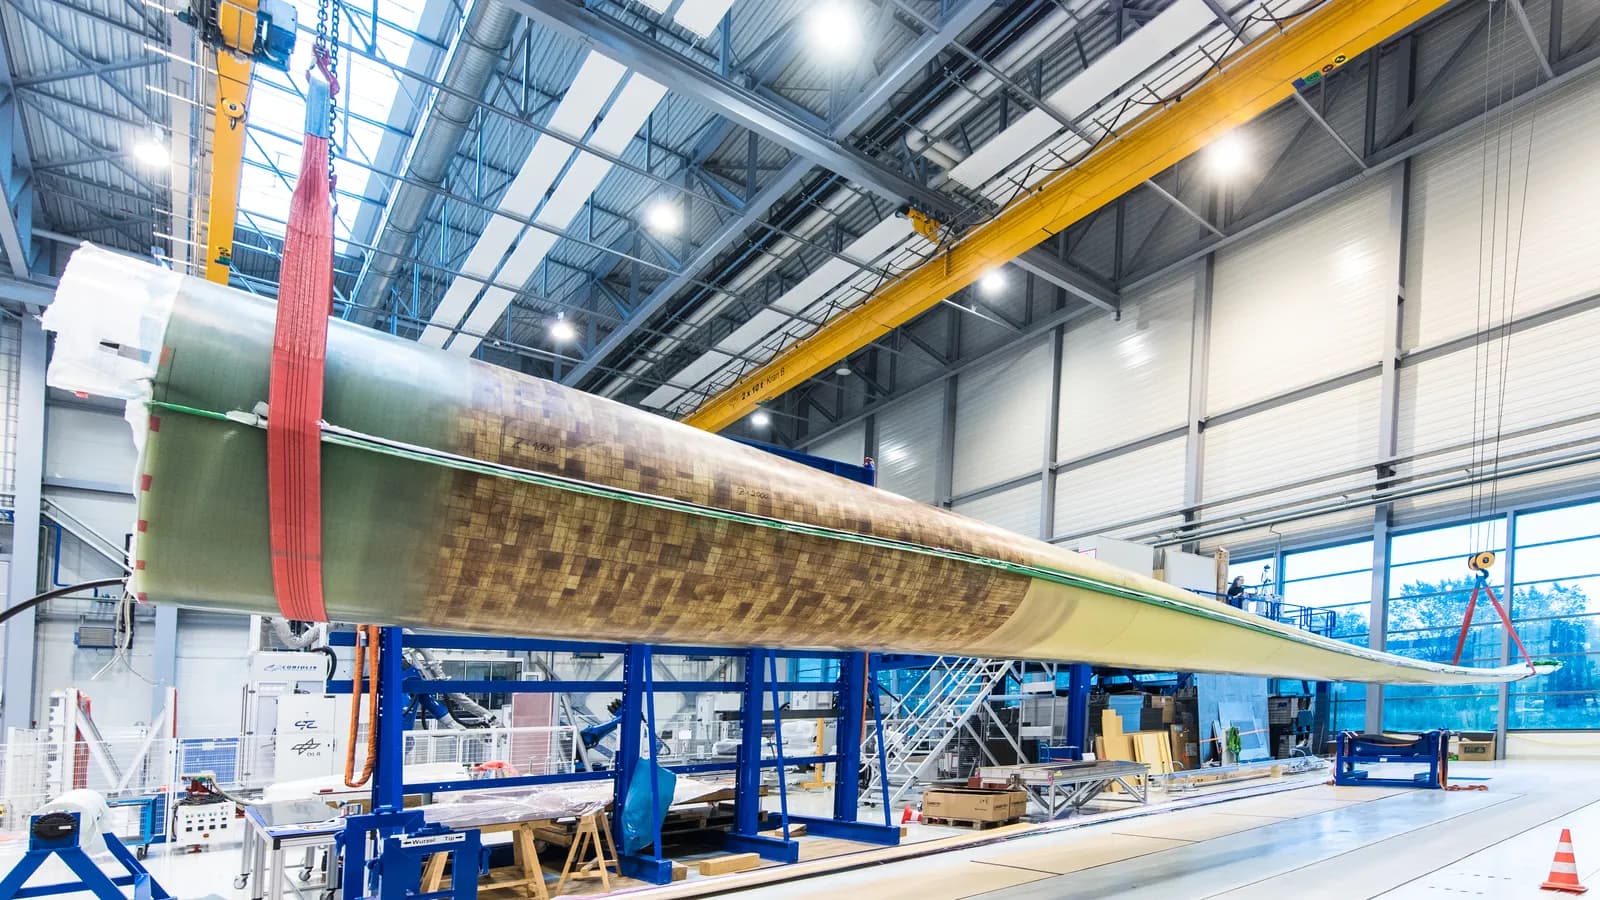
A blade is a structural assembly, not a homogeneous block of FRP. Its shell, spar caps, shear webs, sandwich core, adhesive joints and protective systems have different functions. Glass-fiber fabrics are useful in broad-area laminates and webs; a carbon or high-performance glass spar is selected for the governing structural constraints. Resin chemistry, interface quality and manufacturing consistency determine how much of the fiber’s potential becomes a durable laminate. Sinoma’s own procurement list is representative: glass and carbon fiber reinforcement, balsa, PET or PVC sandwich cores and epoxy matrix resin. [S9] The illustration shows this functional division without claiming a universal material recipe.
Pultruded spar caps can make fiber alignment and repeatable longitudinal reinforcement easier to control. However, conversion, handling and bonding add cost and technical interfaces. Sandia and ORNL’s 2023 study explicitly compares pultruded carbon and glass against infused glass, showing that economic results depend on material and processing assumptions. Its model findings are useful engineering evidence, not a statement of Chinese selling prices or a universal percentage saving. [S11]
Glass and carbon remain competing design choices even within a similar blade length. Sinoma’s annual R&D table describes glass-spar and carbon-spar versions of a 108 m blade and reports different validation stages at year-end. That is a useful counterexample to the idea that every larger blade automatically becomes a carbon blade. Length alone cannot define carbon consumption; load cases, allowable deflection, fatigue, manufacturing method and system cost all influence the selected design. [S9]
Resin procurement deserves the same discipline as reinforcement procurement. An infusion system must fill the actual laminate before its processing window closes, then cure under the plant’s controlled thermal conditions. Thick regions need exotherm control; cured properties and durability must match the design basis. Adhesive qualification also has to address bond thickness, surface preparation and the actual adherends. Replacing an apparently equivalent grade can change the behavior of the complete process.
For market sizing, separate fiber mass from cured composite mass. Carbon spar-cap plates contain both reinforcement and matrix; they are not tonnes of carbon fiber. Fabric shipments may include stitching, binder or multiple reinforcement types. A glass-fiber yarn total for the country covers many industries and cannot be relabeled as wind demand. The strongest demand model starts with an approved bill of materials for each blade program.
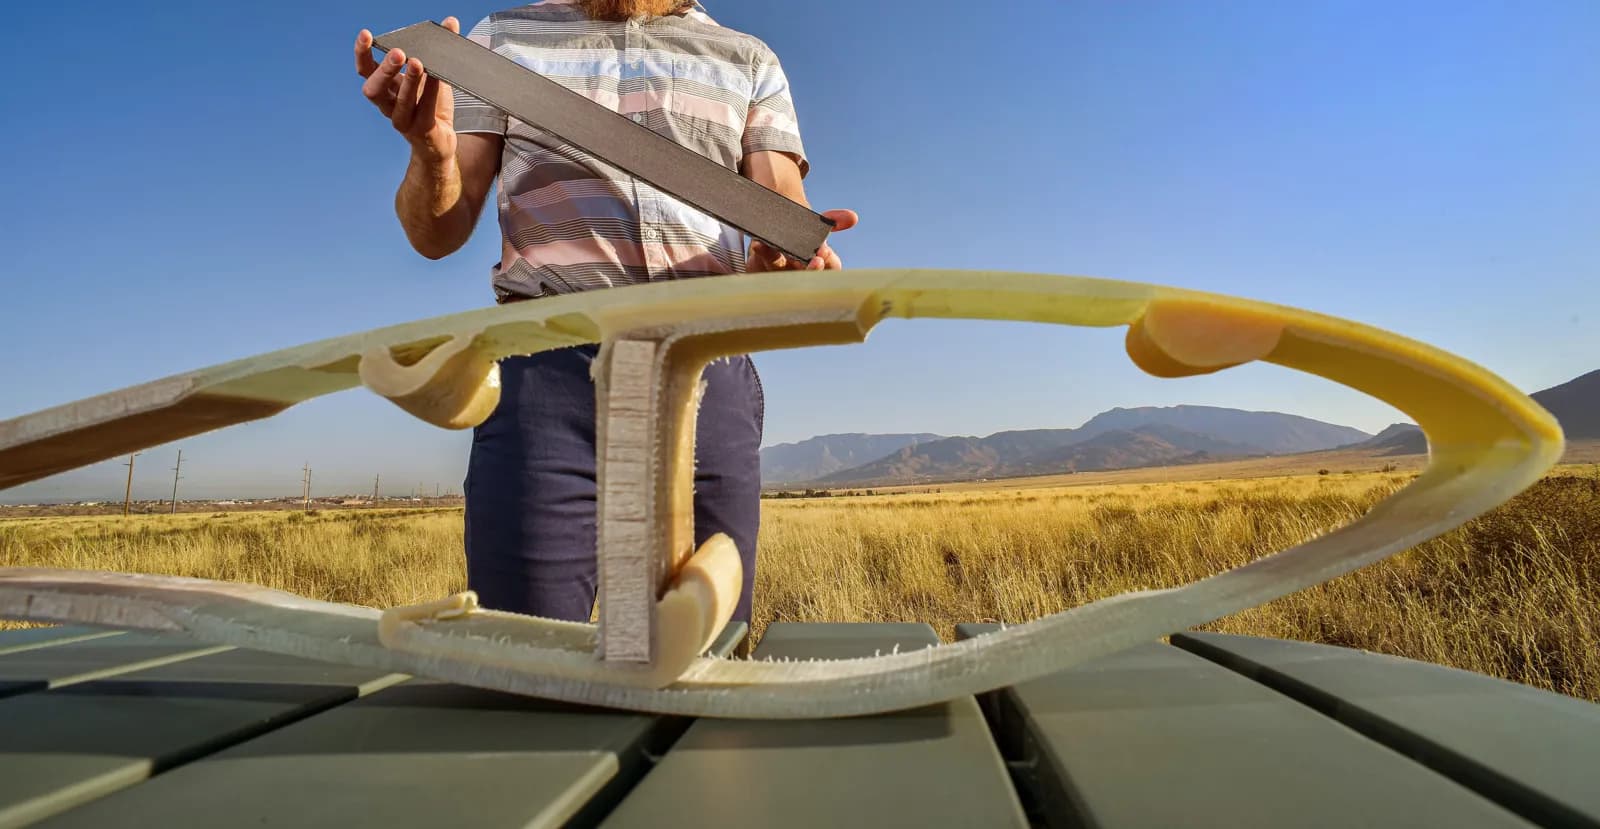
↔ Scroll horizontally to see the full diagram.
7. Chinese composite suppliers: map capabilities to a qualified program
The relevant supplier universe spans material producers, textile converters, pultruders, formulators and blade manufacturers. China Jushi and Chongqing Polycomp International Corporation (CPIC) are useful starting points for glass-fiber grade discussions. Their official portfolios establish company and product scope; an application listing alone does not prove that a grade is approved for a specific wind blade. GetFRP’s profiles link these businesses to their public product information. [S14] [S15]
Weihai Guangwei Composites identifies its energy-materials subsidiary with pultruded wind-blade carbon spars and also presents carbon/glass sandwich products. This provides a more specific link to the wind structural-material chain than a generic statement that the group manufactures carbon fiber. A buyer still needs the manufacturing entity, plant, material system, drawing and approved process for the quoted product. [S16]
Taishan Fiberglass is another established GetFRP directory entry for glass reinforcement, while Sinoma’s disclosed blade operations connect upstream material choices with finished-blade demand. The map below is a capability reference rather than a supplier ranking or an approved-vendor list. It deliberately does not assign market shares to material suppliers when the public evidence does not identify a comparable denominator.
The best purchasing discussion is specific: which OEM platform, which blade revision, which approved material name, which production site and which annual release schedule? That sequence helps distinguish a supplier’s general technical capability from a commercially accessible order. It also makes competitive quotations more comparable because every participant prices the same acceptance basis.
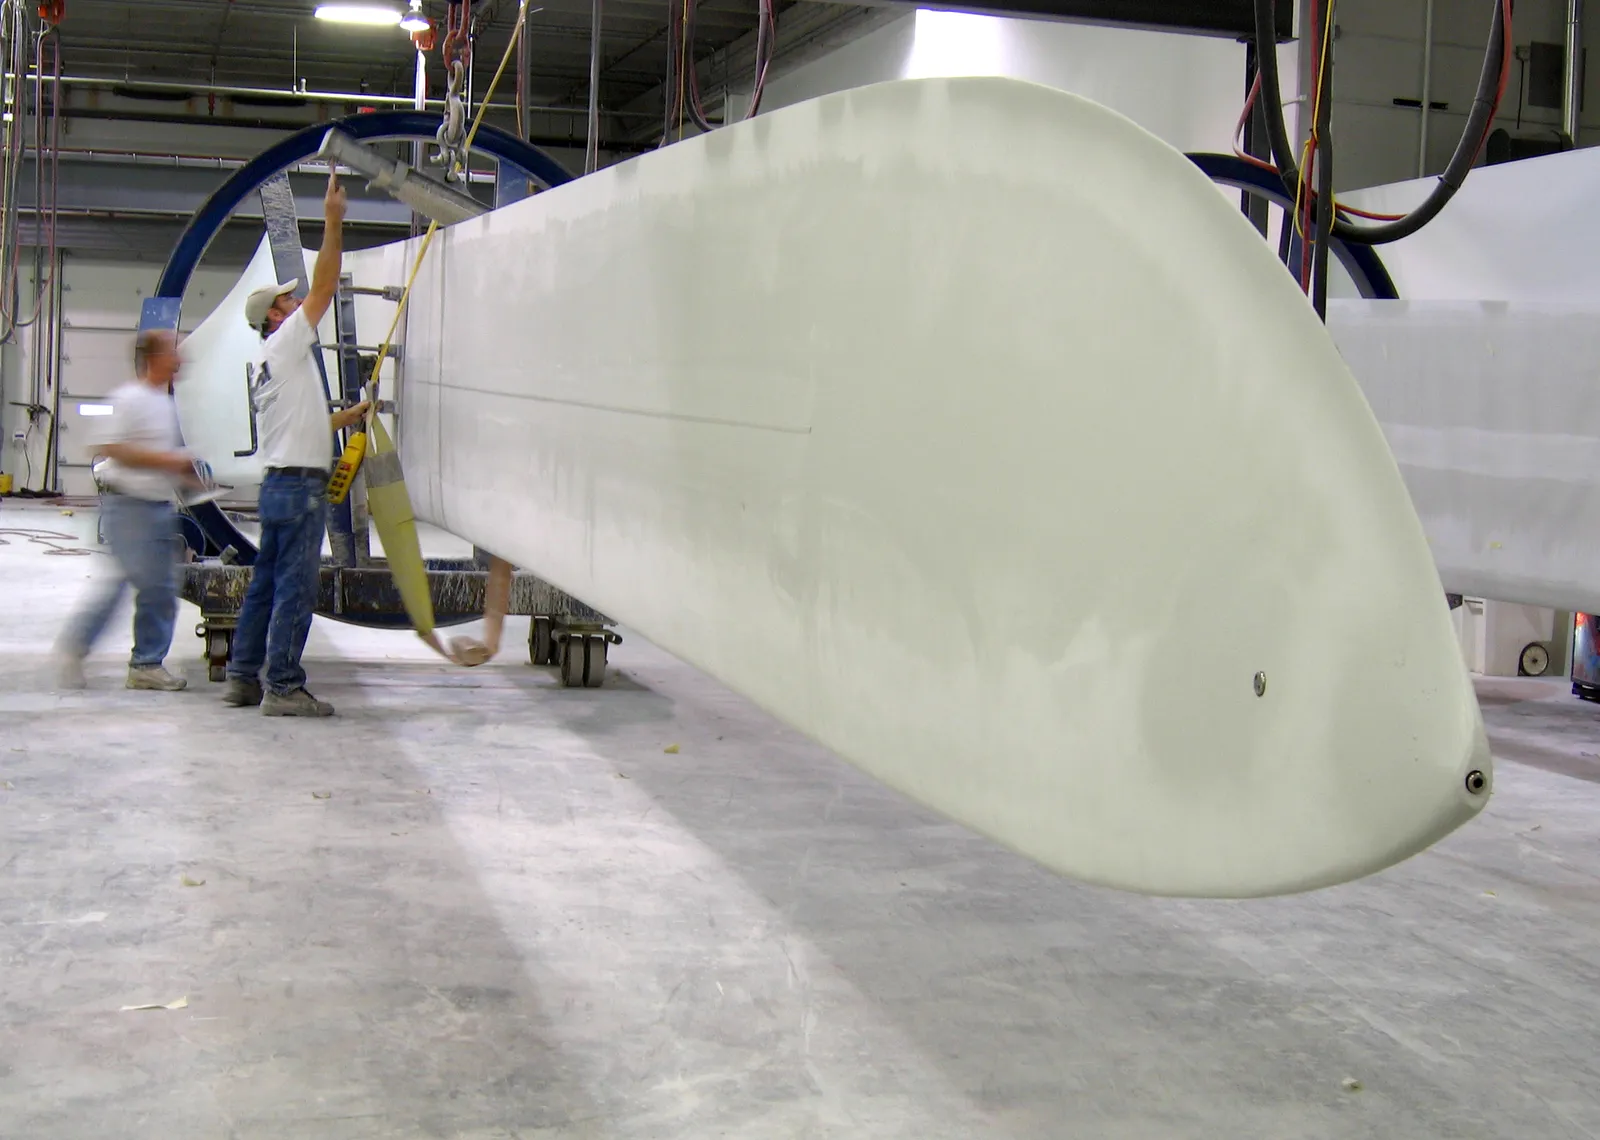
| Company | Position in the chain | What to verify in an RFQ |
|---|---|---|
| China Jushi | Glass-fiber reinforcement | Exact glass grade, sizing and qualified laminate data |
| CPIC | Glass-fiber reinforcement and products | Grade, tex, resin compatibility and plant identity |
| Taishan Fiberglass | Glass reinforcement; GetFRP directory reference | Wind-specific product designation and applicable evidence |
| Weihai Guangwei Composites / energy-materials subsidiary | Pultruded carbon and carbon/glass structural products | Contracting entity, spar geometry, surface and bond qualification |
| Sinoma Science & Technology / blade operations | Blade manufacturing and material qualification | Approved design, production base and material substitution process |
Source: Company sites [S14] [S15] [S16], Sinoma filing [S9], and linked GetFRP company profiles. No project endorsement is implied.
8. Qualification and technical evidence: what a credible supplier package contains
IEC 61400-5 covers blade engineering integrity across design, material selection, manufacture and the operational chain; the publisher lists a consolidated 2020 standard with the 2025 amendment. DNV-ST-0376 likewise provides a rotor-blade design and certification basis for onshore and offshore turbines. Their existence does not mean that every material or factory mentioning them is certified. The applicable edition and certification scope should be fixed by the project contract. [S12] [S13]
GetFRP recommends treating qualification as a chain of evidence. Start with material identity and supplier process control, then demonstrate coupon properties, relevant joints or subcomponents, production trials and the blade program’s required validation. A high tensile result from an isolated fiber does not establish the compression, fatigue, environmental or bonding performance of a manufactured spar. Likewise, a passing specimen cannot excuse an uncontrolled production change.
The purchasing specification should record the testing method and acceptance logic, not merely a list of impressive properties. Define the specimen orientation, conditioning, sample preparation, statistical basis, laboratory competence and linkage to the production batch. For pultruded products, dimensions and surface state are part of structural fit and bonding quality. For resin, processing and cured-state data must both be traceable to the delivered formulation.
Incoming inspection can confirm identity and screen deviations, but it does not replace the original material qualification. Establish notification rules for raw-material, sizing, formulation, plant and equipment changes before approving recurring supply. Preserve retained samples and production records so that a defect investigation can distinguish material, handling, infusion, cure and assembly causes.
| Material / component | Evidence package | Commercial implication |
|---|---|---|
| Glass or carbon reinforcement | Identity, sizing, batch CoA, laminate properties and variability | Approve the grade and manufacturing site |
| Pultruded spar-cap plate | Geometry, fiber volume, cure, compression/fatigue, surface and bonding evidence | Price accepted plate and traceability, not fiber alone |
| Infusion resin / adhesive | Viscosity and process window, cure, thermal/mechanical properties and durability | Specify storage, shelf life and process support |
| Core and sandwich laminate | Density/thickness, shear and bonding behavior, processing compatibility | Check the full sandwich system |
| Finished blade or major design change | Design basis, validated models, relevant full-scale testing and manufacturing controls | Qualification belongs to the specific program |
Source: GetFRP procurement framework informed by the published scopes of IEC [S12] and DNV [S13]; not a reproduction of normative clauses.
9. From GW to material demand: use a program-based model
A useful composite-demand model starts with turbine units, not a national constant in tonnes per GW. For each platform, divide contracted project power by rated turbine power, then multiply by blades per turbine and the approved material mass per blade. Apply the proportion of blade designs using the material, manufacturing yield and the procurement schedule. Account separately for exported blade sets, stock movements and replacement work. These inputs should come from the customer or a disclosed engineering bill of materials.
In compact form, purchased material equals the sum across programs of turbine units × blades per turbine × material mass per blade × adoption share ÷ material yield, adjusted for timing and inventory. All mass terms must use the same definition: raw fiber, dry fabric, cured plate or resin system. An uncertain adoption share should be shown as a range; substituting an unsupported national average simply hides the uncertainty.
This structure also reveals where commercial upside comes from. More installed power can increase turbine orders, but larger turbine ratings can reduce unit counts for the same GW. Longer or differently loaded blades can alter the material mass per unit. Carbon adoption can rise in a selected spar program while glass demand persists in shells and webs. Production yield improvements can reduce purchased tonnes even when accepted blade output rises.
For investment or sales planning, build three conditional cases around the customer’s actual pipeline. In a delayed case, push commissioning and material call-offs back while maintaining minimum stock. In an execution case, use approved orders and current material designs. In a technology-change case, incorporate a confirmed platform redesign only after its qualification and production timing are evidenced. These are planning scenarios, not numerical forecasts of China’s national wind market.
Do not convert the whole wind market with one tonnes-per-GW factor
Blade architecture, turbine rating, carbon adoption, exports, yield and order timing change the answer. Public grid statistics alone cannot establish a defensible national carbon-fiber or resin tonnage forecast.
10. Outlook and research boundaries
GetFRP’s assessment is that the most defensible commercial opportunity is qualified supply to identifiable blade platforms, together with services supporting the growing operating fleet. The evidence supports a large industrial market and continued scale in China; it does not support assuming that the exceptional 2025 addition rate will repeat each year. January–September 2026 additions of 60.66 GW were level with 2025, but 2025 then connected about 59 GW in its fourth quarter, and utilization has fallen to 92.1%, so project execution and energy offtake remain directly relevant to material demand. [S5] [S17]
Watch four indicators together: firm turbine awards and delivery schedules; the conversion of those awards into blade production slots; grid and installation readiness; and cash collection through the chain. A rising national capacity headline can coexist with weak pricing or deferred purchasing at an individual supplier. Conversely, a company with approved export programs can grow even when domestic commissioning slows.
The research cut-off is 3 November 2026. Full-year comparisons use the 2024 and 2025 NEA renewable-operation releases; the matched operating dashboard uses January–June and January–September NEA data on a grid-connected basis, the latest available at cut-off. Company figures refer to FY2025 annual reports and H1 2026 interim reports and retain their entity, product and geographic boundaries. CWEA figures are accessed through an association republication and a listed-company filing, with that provenance stated.
Unit conversions are explicit: 10,000 kW equals 0.01 GW; 100 million kWh equals 0.1 TWh; 1,000 MW equals 1 GW; RMB 1 billion equals RMB 10 hundred-million. Calculated growth rates use (current ÷ prior − 1) × 100. Percentage-point changes subtract two percentages directly. Rounding, revisions and differing statistical populations can create small discrepancies; no data are interpolated to make incompatible series match.
Company descriptions are attributed capabilities, not an audit, endorsement or certificate verification. Technical sections combine cited research and standards scopes with GetFRP’s procurement analysis. The report makes no national composite-tonnage estimate, adopts no broker target as an observed outcome and does not treat an announced plant, prototype turbine or test blade as completed commercial output.
Frequently asked questions
How large is China’s wind power market?
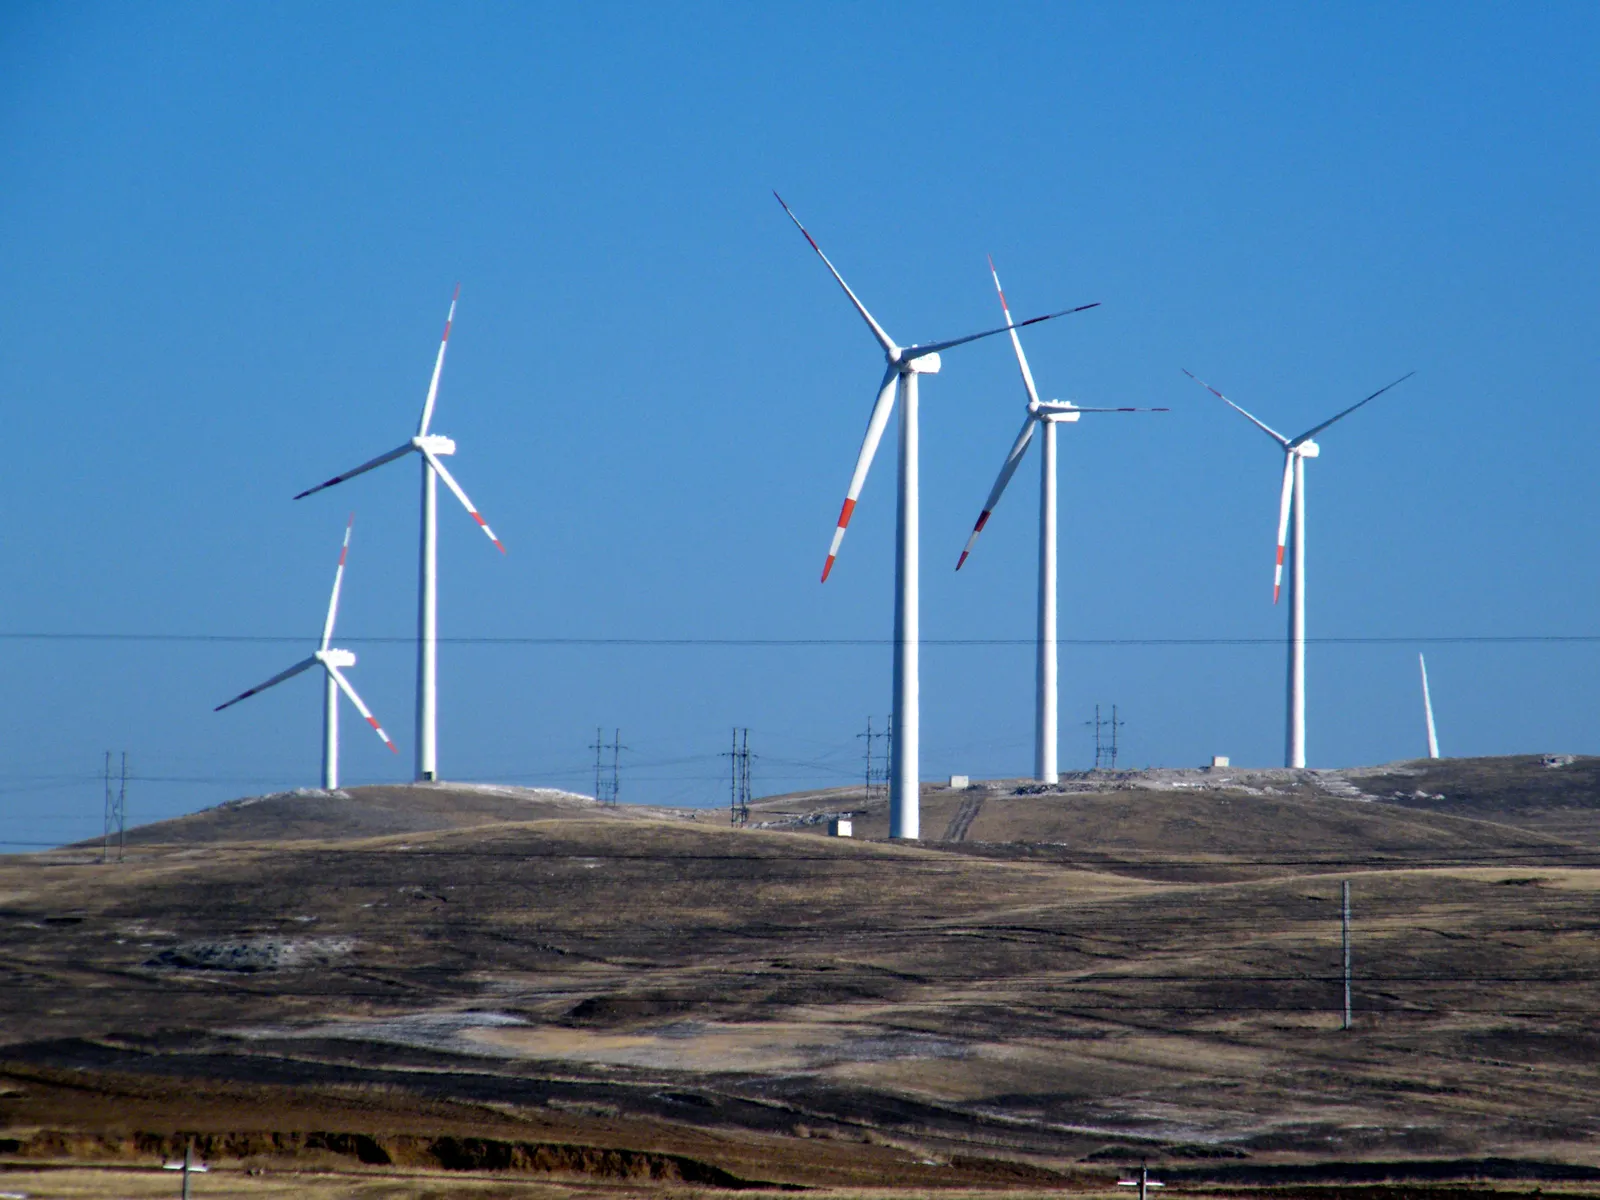
NEA reports 700 GW of grid-connected wind capacity at the end of September 2026 (650 GW onshore, 49.84 GW offshore), up 20.4% year on year. China connected 120 GW in 2025 and 60.66 GW in January–September 2026. These are operating-capacity measures; equipment sales, project investment and material purchases need separate market definitions. [S1] [S5]
Why do NEA and CWEA wind installation totals differ?
NEA counts capacity connected to the grid; CWEA counts turbines hoisted. For 2025 NEA reports 120 GW, while CWEA reports about 130 GW (130.82 GW in its OEM table) from 18,272 turbines. Offshore shows the gap the other way: 6.59 GW connected versus 5.603 GW installed. A difference between the totals is not an estimate of unsold inventory. [S1] [S6] [S7]
Who are the largest wind turbine manufacturers in China?
On CWEA’s 2025 domestic installation basis: Goldwind 25.90 GW, Windey 19.24 GW, Mingyang 18.55 GW, Envision 17.58 GW and Sany 14.71 GW, followed by CRRC and Dongfang Electric. The top five held 73.4% of new installations. [S6] [S7]
How much offshore wind did China install in 2025 and 2026?
NEA reports 6.59 GW of offshore grid connections in 2025 and 2.45 GW in January–September 2026, down from 3.50 GW in the same period of 2025. Offshore capacity reached 49.84 GW at the end of September 2026. Offshore was about 5.5% of 2025 connections and 4.0% of January–September 2026 connections (GetFRP calculations), but its turbines averaged 10.095 MW in 2025 on CWEA’s basis and carry the longest blades. [S1] [S5] [S6] [S17]
Does every large wind turbine blade use carbon fiber?
No. Carbon, high-performance glass and hybrid structures are design choices. Sinoma’s disclosed development work includes glass-spar and carbon-spar versions of a 108 m blade, illustrating why blade length alone cannot establish a carbon-fiber requirement. [S9]
Can wind capacity be converted directly into carbon-fiber demand?
A credible calculation needs the turbine mix, number of blades, material mass per design, carbon adoption, production yield and purchasing schedule. A universal tonnes-per-GW factor omits these variables and is not used in this report.
What should buyers check when sourcing wind blade materials in China?
Confirm the approved material and plant, manufacturing entity, resin/fiber compatibility, batch traceability, relevant test evidence, change control and commercial delivery scope. A supplier directory or generic certification statement is not proof of approval for a specific blade program.
Sources and scope
Figures were cross-checked against primary documents where available; secondary citations are marked in each scope note. Company figures are reported as disclosed by the companies themselves. This note is an independent market assessment and not investment advice.
- [S1]NEA — 2025 renewable energy grid operation, 12 February 2026
Full-year 2025 China grid-connected capacity, generation, geography and utilization; rounded national figures.
- [S2]NEA — 2024 renewable energy grid operation
Full-year 2024 additions and installed capacity; original publication date shown as 27 January 2025.
- [S3]NEA — First-half 2026 press conference, 30 July 2026
January–June 2026 wind additions, onshore/offshore split, generation and utilization.
- [S4]NEA — First-half 2025 press conference, 31 July 2025
January–June 2025 comparison period for additions, generation and utilization.
- [S5]NEA — Press conference transcript, January–September 2026 renewable grid operation, 30 October 2026
January–September 2026 wind grid connections (60.66 GW; 58.21 GW onshore, 2.45 GW offshore), end-September grid-connected capacity (700 GW, +20.4%; 650 GW onshore, 49.84 GW offshore), generation 855.4 TWh and utilization 92.1%. Supersedes the January–August snapshot (693 GW) used before 2026-11-03.
- [S6]CWEEA — Republication of CWEA 2025 installation statistical brief
Association-hosted republication, 6 March 2026: completed turbine installations, average turbine ratings, concentration and exports; not NEA grid connections.
- [S7]Shanghai Electric Wind Power — 2025 annual report, revised filing
Printed page 15 reproduces CWEA domestic 2025 OEM installation ranking and total 130.82 GW. Company filing, not independently audited market statistics.
- [S8]Goldwind — 2025 annual report
Printed pages 7 and 22–23: consolidated revenue, product revenue, margin, turbine sales/production/inventory; domestic and international businesses included.
- [S9]Sinoma Science & Technology — 2025 annual report
Printed page 11: blade raw materials (glass and carbon fiber reinforcement, balsa/PET/PVC cores, epoxy matrix); pages 19–20: wind-blade product revenue, margin, production and sales; page 22: development/testing status of 108 m glass/carbon spar designs. Group product scope, including overseas operations.
- [S10]NDRC and NEA — Renewable electricity pricing reform Q&A
9 February 2025 explanation of Document 136, market participation and 1 June 2025 boundary between existing and new projects. Provincial implementation must be checked separately.
- [S11]Sandia / ORNL — Economic competitiveness of pultruded fiber composites for wind turbine applications
Ennis, Norris and Das, Composites Part B 265 (2023), DOI 10.1016/j.compositesb.2023.110960. Model-specific manufacturing economics; not a China market survey.
- [S12]IEC — IEC 61400-5:2020+AMD1:2025 consolidated version
Publisher record: edition 1.1, 28 August 2025; blade design, materials, manufacturing, transport, installation and operational scope. No paid clauses reproduced.
- [S13]DNV — DNV-ST-0376 Rotor blades for wind turbines
Publisher record for edition 2024-04 and its scope; no claim that a listed supplier holds certification.
- [S14]China Jushi — Official product and application website
Company-published glass-fiber portfolio and wind-energy application context; verify quoted grade separately.
- [S15]CPIC — Official company and product website
Company-published glass-fiber, roving and composite material scope; supplier identity and portfolio, not project approval.
- [S16]Guangwei Composites — Wind-blade carbon spar products
Company-published pultrusion and carbon/glass spar product scope of Weihai Guangwei Energy New Materials; not market share.
- [S17]NEA — First-three-quarters 2025 renewable energy grid operation press conference, 31 October 2025
January–September 2025 comparison period: 61.09 GW new wind connections (57.59 GW onshore, 3.50 GW offshore), 582 GW cumulative (+21.3%), 813.7 TWh generation, 94.0% utilization.
- [S18]GWEC — Global Wind Report 2026 launch release, 20 April 2026
Global 2025 grid-connected additions (165 GW, +40%), cumulative 1,299 GW, China 120.5 GW and 6.6 GW offshore, global offshore 9.3 GW. GWEC compilation; its China figure differs slightly from NEA’s rounded 120 GW. The 2026–2030 outlook in the release is a forecast and is not used here.
- [S19]Goldwind — 2026 semi-annual report
Printed pages 7, 12 and 20: H1 2026 revenue RMB 33.74 billion, turbine and component revenue RMB 27.26 billion at 11.62% gross margin, external turbine sales 12,364.38 MW (+16.19%). Unaudited interim figures; external-sales basis differs from the annual sales-volume table.
- [S20]Sinoma Science & Technology — 2026 semi-annual report
Printed pages 9, 11 and 15: H1 2026 blade sales 15.5 GW (+2%), blade revenue RMB 5.58 billion at 12.00% gross margin (−4.38 points); company commentary that blade-industry capacity exceeds demand and that H1 turbine tenders exceeded 75 GW (company-cited industry data).
Image provenance and usage terms appear in each caption; see image credits. Submit a source correction.