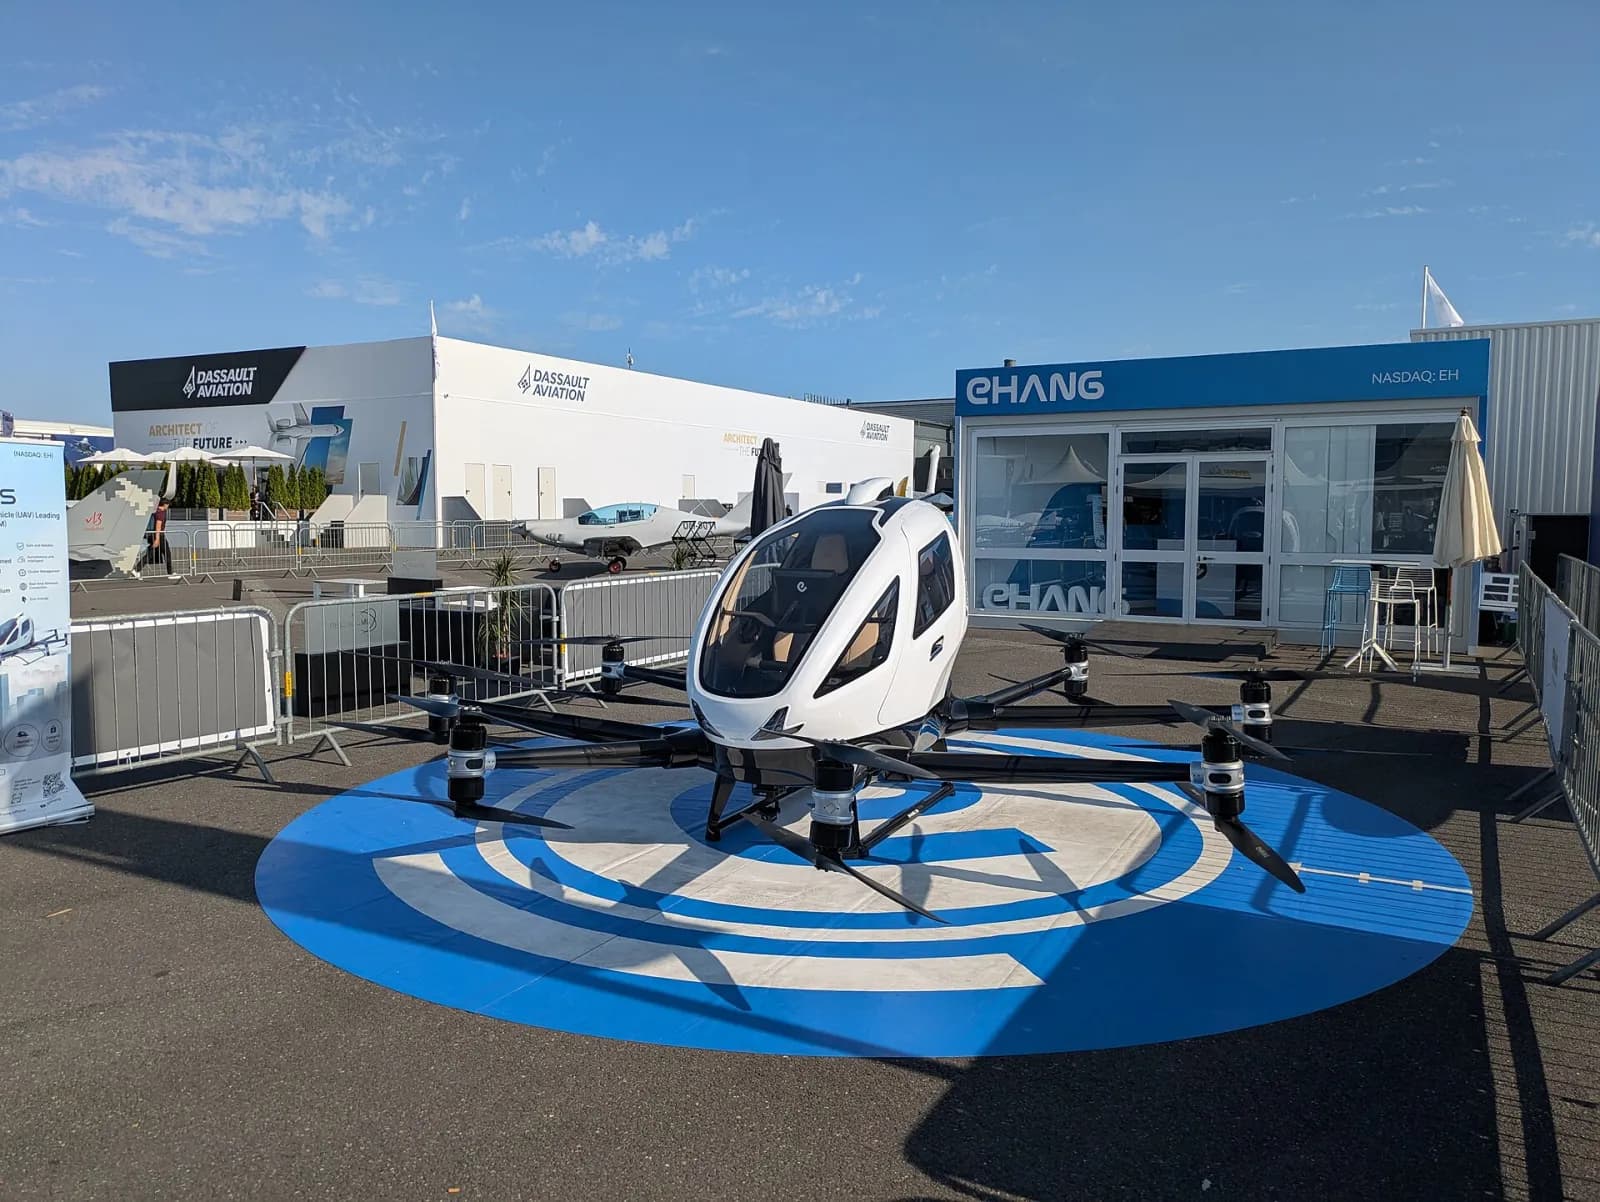
1. Low-altitude economy: China certifies first, Europe consolidates
The policy signal in China is settled. The low-altitude economy entered the Government Work Report in March 2024 as a new growth engine, the National Development and Reform Commission created a Low-Altitude Economy Department in December 2024, the 2026 Government Work Report calls it an emerging pillar industry, and two mandatory national drone standards including real-name registration took effect on 1 May 2026 [S14]. Certification is where China moved first, and it is the single most important fact for material suppliers: the first certified programs fix the material specifications that later orders must follow.
Drones, not passenger aircraft, remain the only segment at industrial scale. Registered drones reached 3.287 million at end-2025, up 51.0%, with 45.3 million flight hours in the year, up 69.9%, and 46 networked low-altitude flight-service stations [statistic, CAAC] [S22]; real-name registrations passed 4.788 million by the end of June 2026 [official, CAAC] [S23]. The often-quoted RMB 1.5 trillion market size for 2025 is a CAAC forecast relayed by media [S13]; CCID Consulting estimated the 2024 market at RMB 670.25 billion across manufacturing, infrastructure, operations and services [forecast, CCID] [S24].
| Aircraft | Developer | Class | Status | Evidence |
|---|---|---|---|---|
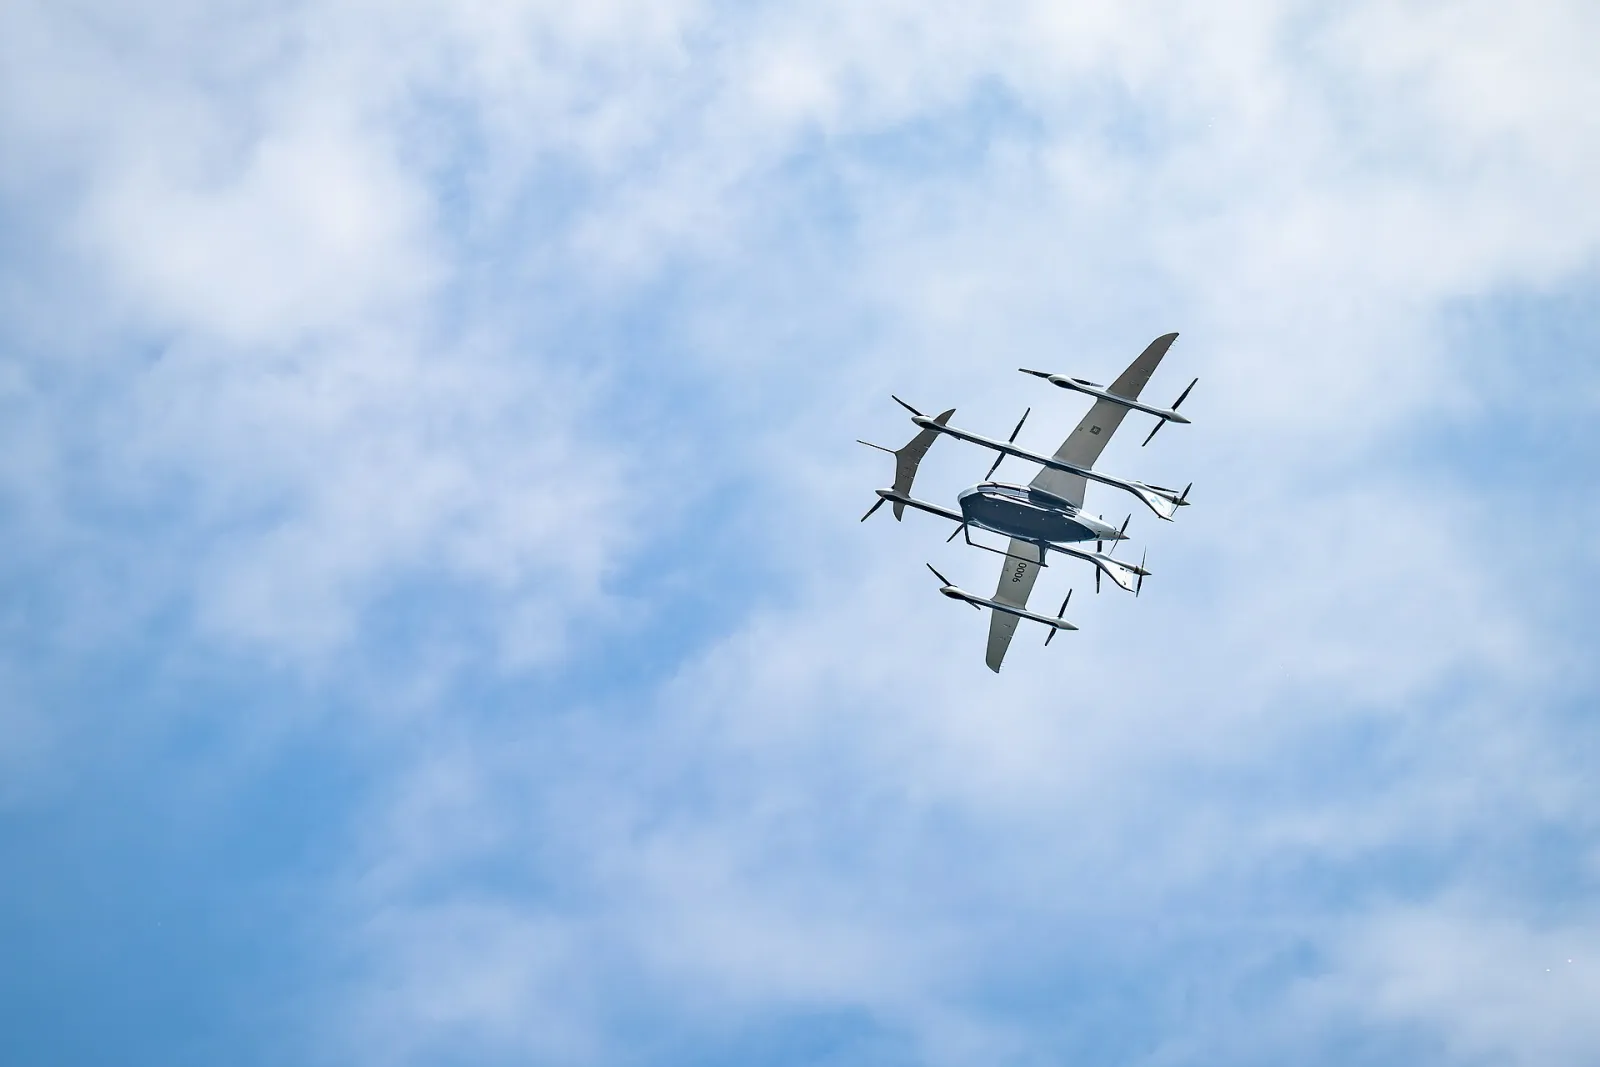
| EH216-S | EHang | 2-seat pilotless multirotor | CAAC TC Oct 2023, AC Dec 2023, PC Apr 2024, first OC Mar 2025 | company, CAAC |
| V2000CG CarryAll | AutoFlight | 2-tonne-class cargo lift-plus-cruise | CAAC TC Mar 2024; first three-certificate delivery Jul 2025; Indonesian type validation Jun 2026 | company |
| S4 | Joby Aviation | Tilt-rotor, 4 passengers | FAA type certification stage 5 of 5; no TC at cut-off | company |
| Midnight | Archer Aviation | Tilt/lift, 4 passengers | FAA certification in progress; no TC at cut-off | company |
| VX4 | Vertical Aerospace | Tilt-rotor, 4 passengers | Certification target 2028; Syensqo structural supply since Dec 2025 | company |
| Lilium Jet | Lilium | Ducted vectored thrust | Second insolvency filed 21 Feb 2025; program effectively ended | media, Aviation Week |
| VoloCity | Volocopter | Multirotor, 2 seats | Assets acquired by Diamond Aircraft (Wanfeng) Mar 2025 for about EUR 10 million | media, AIN |
Source: Company announcements (AutoFlight [S27]; Syensqo–Vertical [S18]), CAAC, FAA and trade press (AIN [S21]; Aviation Week [S28]); see Sources.
2. Carbon fiber market 2025: wind drives the volume, aerospace keeps the value
Guangzhou Sail Carbon Fiber counts global demand at 224,510 t in 2025, after 2023 brought the first decline since 1995. Wind blades took about 100,000 t, or 44.5%, up 127% in a year and roughly 82% of the global increase [estimate]. Aerospace and defense was only 12.6% of composite volume but about 60.8% of composite value [survey, Sail] [S1]. Toray's own, narrower estimate puts 2025 demand at 138 kt rising to 179 kt by 2028, a 9% compound rate [company, June 2026 investor day] [S5]. The two series use different scopes, are not reconcilable and should never be averaged.
Prices roughly halved between 2022 and 2025 and are now firming. Sail puts the average price of Chinese-supplied fiber at USD 18/kg in 2025, down from USD 33/kg in 2022, with China's operating capacity of 171,080 t running at 66.3% utilization [survey, Sail] [S1]. Toray, which held prices low through most of 2025 to keep share, announced increases at year-end [S1], and Baiinfo's daily market average for Chinese carbon fiber stood at RMB 85.5/kg on 3 November 2026 [statistic, Baiinfo] [S15].
↔ Scroll horizontally to see the full chart and data table.
Source: Guangzhou Sail Carbon Fiber, 2025 Global Carbon Fiber Composites Market Report (April 2026). 2019–2023 values are from earlier annual editions of the same Sail series; 2021 omitted: no verified figure in the same series.
View the chart data and evidence
| Series | Category | Value | Unit | Evidence / value basis | Reported range | Point note |
|---|---|---|---|---|---|---|
| — | 2019 | 103700 | tonnes | Industry survey | — | — |
| — | 2020 | 106900 | tonnes | Industry survey | — | — |
| — | 2022 | 135000 | tonnes | Industry survey | — | — |
| — | 2023 | 115000 | tonnes | Industry survey | — | — |
| — | 2024 | 156100 | tonnes | Industry survey | — | — |
| — | 2025 | 224510 | tonnes | Industry survey | — | — |
↔ Scroll horizontally to see the full chart and data table.
Source: Guangzhou Sail Carbon Fiber, 2025 Global Carbon Fiber Composites Market Report (April 2026). * Other (pressure vessels, automotive, carbon/carbon and remaining uses) is the remainder after the three reported segments [estimate].
View the chart data and evidence
| Series | Category | Value | Unit | Evidence / value basis | Reported range | Point note |
|---|---|---|---|---|---|---|
| — | Wind blades | 100000 | t | Industry survey | — | — |
| — | Sports and leisure | 31350 | t | Industry survey | — | — |
| — | Aerospace and defense | 30000 | t | Industry survey | — | — |
| — | Other applications | 63160 | t | GetFRP estimate | — | — |
↔ Scroll horizontally to see the full chart and data table.
Source: Guangzhou Sail Carbon Fiber, 2025 Global Carbon Fiber Composites Market Report (April 2026)
View the chart data and evidence
| Series | Category | Value | Unit | Evidence / value basis | Reported range | Point note |
|---|---|---|---|---|---|---|
| Share of volume | 2022 | 14.9 | % | Industry survey | — | — |
| Share of volume | 2023 | 19.1 | % | Industry survey | — | — |
| Share of volume | 2024 | 15.3 | % | Industry survey | — | — |
| Share of volume | 2025 | 12.6 | % | Industry survey | — | — |
| Share of composite value | 2022 | 46.7 | % | Industry survey | — | — |
| Share of composite value | 2023 | 62.8 | % | Industry survey | — | — |
| Share of composite value | 2024 | 61.9 | % | Industry survey | — | — |
| Share of composite value | 2025 | 60.8 | % | Industry survey | — | — |
↔ Scroll horizontally to see the full chart and data table.
Source: Shanghai Metals Market via CITIC New Materials; broker reports; Baiinfo (Aug 2025 range RMB 90–120/kg, midpoint shown). * Jan 2022 back-calculated from the reported 37% decline to Oct 2022; Aug 2025 is the midpoint of a reported range [estimate].
View the chart data and evidence
| Series | Category | Value | Unit | Evidence / value basis | Reported range | Point note |
|---|---|---|---|---|---|---|
| — | Jan 2022 | 230 | RMB/kg | GetFRP estimate | — | — |
| — | Oct 2022 | 145 | RMB/kg | Statistic | — | — |
| — | Mar 2024 | 140 | RMB/kg | Statistic | — | — |
| — | Jul 2024 | 110 | RMB/kg | Statistic | — | — |
| — | Aug 2025 | 105 | RMB/kg | GetFRP estimate | — | — |
| Producer | 2025 position | Low-altitude relevance | Profile |
|---|---|---|---|
| Jilin Chemical Fiber (Jilin Carbon Valley) | Group capacity disclosed as 70,000 and 74,000 t/a in separate 2026 provincial statements; 56,000 t sold, the largest volume of any producer; 100,000 t/a target end-2026 | Large-tow industrial grades; reported trial use at EHang, volumes small | — |
| Zhongfu Shenying | 25,054 t sold in 2025 [S30]; new Lianyungang lines commissioned 2026; SYT80 (T1200-class) at 100-tonne scale | Reported direct or indirect supply to EHang and XPeng AeroHT; prepreg base in Shanghai Lingang | View profile |
| Weihai Guangwei | T1100-class at 100-tonne engineering scale; 2025 net profit RMB 603 million, down 18.6% | Light-aircraft composite structures project started; preparing for PCD audit | View profile |
| Jiangsu Hengshen | First Chinese 1,000 t/a T800 line; 20,000 t Yulin plant in 2026 | Led April 2026 price increases; aerospace prepreg supplier | — |
| Toray (incl. Zoltek) | About 28% global share; FY2025 segment core profit JPY 17.6 billion vs JPY 36 billion target | Joby's airframe, propulsion and interior composites under a 2020 long-term agreement | — |
| Hexcel | 2025 sales USD 1.894 billion; commercial aerospace about 61% | Letter of intent with Archer (Apr 2022) to supply carbon fiber prepreg for production aircraft | — |
| Sinopec Shanghai Petrochemical | 30,000 t/a large-tow project, 6,000 t first phase in 2026 | Industrial grades; no aerospace qualification disclosed | View profile |
Source: Company reports, Sail, trade press; 'Profile' links open GetFRP supplier pages where one exists.
3. Glass fiber market 2025: roving at the bottom, electronic cloth at a peak
China produced 8.43 million t of glass fiber yarn in 2025, up 11.5%, with tank-furnace yarn at 96% of the total and 860,000 t of new capacity from seven new and three cold-repaired furnaces. Apparent domestic consumption rose 16.7% to 6.585 million t while exports slipped 3.6% to 1.95 million t [statistic, CGFIA] [S2]. By the end of June 2026 total yarn capacity was about 9.3 million t, of which 8.65 million t was tank-furnace capacity in production, and first-half output grew about 7.9% [statistic, CGFIA flash data] [S3].
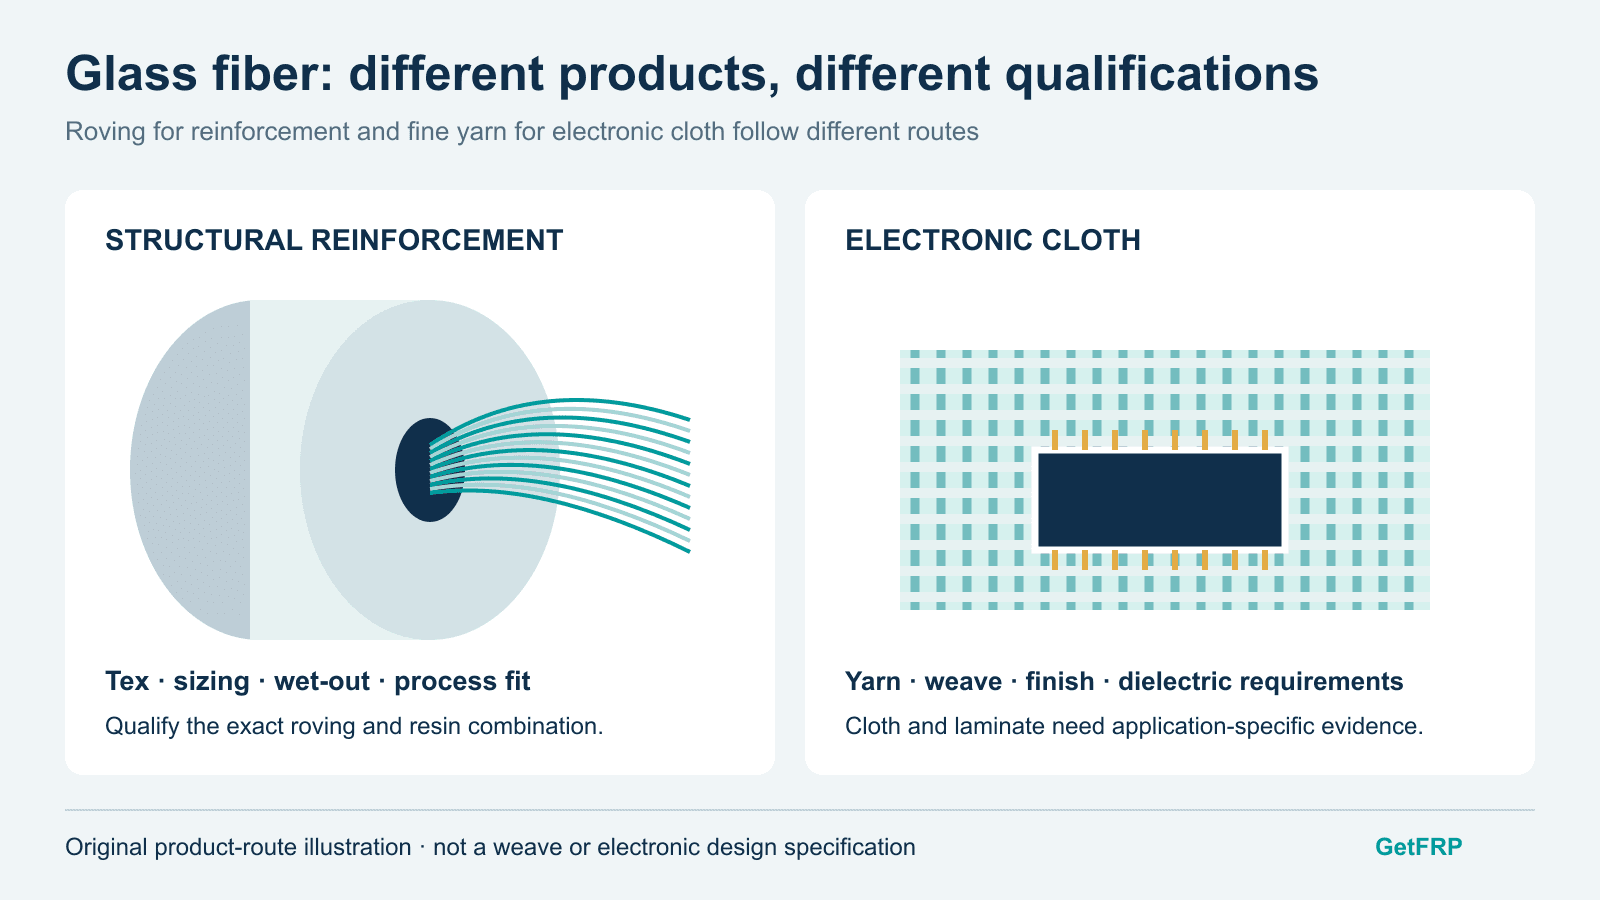
The cycle is K-shaped. Standard alkali-free roving bottomed at RMB 3,113/t in March 2024 and has recovered only to RMB 3,600 to 3,900/t, while electronic yarn and cloth went the other way on AI server demand: G75 yarn averaged RMB 23,450/t on 15 September 2026, up 167.4% year on year, and 7628 cloth averaged RMB 10.2/m in August 2026, up 162% year on year and 121% since January [statistic, Sublime China Information] [S3]. Trade policy is now a structural cost. In September 2026 the EU renewed its 13.1% countervailing duty on Egyptian continuous filament glass fiber for five years [official, Implementing Regulation 2026/2107] [S25]; it stacks with the 11.0% anti-dumping duty applied since 15 April 2026, a combined 24.1% on Jushi's Egyptian base [estimate], while CPIC's Bahrain plant pays 11.8% and Thai producers 15.3–25.4% [official, Implementing Regulation 2026/831 as corrected by 2026/1371] [S12].
↔ Scroll horizontally to see the full chart and data table.
Source: China Glass Fiber Industry Association, 2025 annual report; Sublime China Information price series; 2020–2022 association figures as quoted by Qianzhan and Huaon; 2023 by Guanyan. 2020–2022 are association figures quoted by Qianzhan [S31] and Huaon [S32] [S33]; 2019 is implied by the 2020 figure of 5.41 Mt, up 2.64%.
View the chart data and evidence
| Series | Category | Value | Unit | Evidence / value basis | Reported range | Point note |
|---|---|---|---|---|---|---|
| — | 2019 | 5.27 | million tonnes | Statistic | — | — |
| — | 2020 | 5.41 | million tonnes | Statistic | — | — |
| — | 2021 | 6.24 | million tonnes | Statistic | — | — |
| — | 2022 | 6.87 | million tonnes | Statistic | — | — |
| — | 2023 | 7.23 | million tonnes | Statistic | — | — |
| — | 2024 | 7.56 | million tonnes | Statistic | — | — |
| — | 2025 | 8.43 | million tonnes | Statistic | — | — |
↔ Scroll horizontally to see the full chart and data table.
Source: Sublime China Information via broker weeklies and industry reviews. Observations are unevenly spaced in time; the line shows direction, not a continuous series.
View the chart data and evidence
| Series | Category | Value | Unit | Evidence / value basis | Reported range | Point note |
|---|---|---|---|---|---|---|
| — | 2023 avg | 3762 | RMB/t | Statistic | — | — |
| — | Mar 2024 | 3113 | RMB/t | Statistic | — | — |
| — | Feb 2025 | 3800 | RMB/t | Statistic | — | — |
| — | Feb 2026 | 3604 | RMB/t | Statistic | — | — |
| — | Apr 2026 | 3729 | RMB/t | Statistic | — | — |
| — | Jun 2026 | 3791 | RMB/t | Statistic | — | — |
| — | Sep 2026 | 3732 | RMB/t | Statistic | — | — |
↔ Scroll horizontally to see the full chart and data table.
Source: Sublime China Information via Securities Star industry review (13 October 2026). August 2026 is up 162% year on year and 121% since January.
View the chart data and evidence
| Series | Category | Value | Unit | Evidence / value basis | Reported range | Point note |
|---|---|---|---|---|---|---|
| — | Q1 2026 avg | 5.15 | RMB/m | Statistic | — | — |
| — | Q2 2026 avg | 6.73 | RMB/m | Statistic | — | — |
| — | Aug 2026 avg | 10.2 | RMB/m | Statistic | — | — |
| Producer | 2025 scale | Specialty grades relevant to aircraft | Profile |
|---|---|---|---|
| China Jushi | 3.20 million t roving and products sold; revenue RMB 18.88 billion; about 23% of global capacity | High-modulus wind yarn; electronic cloth 1.062 billion m | View profile |
| Taishan Fiberglass (Sinoma Science and Technology) | 1.37 million t sold, second globally | Low-dielectric generation 1 and 2, low-CTE and quartz cloth across the full range | View profile |
| Chongqing International Composite Materials (CPIC) | 1.177 million t sold; more than 1.2 million t/a yarn capacity; over 25% share in wind yarn and fabrics | TM/TMII high-modulus (TMII above 95 GPa, 100 GPa developed 2025); HT high-strength to 4,000 MPa; HL/LDK low-dielectric; quartz cloth in pilot | View profile |
| PGTEX (Changzhou Hongfa Zongheng, CPIC subsidiary) | Multiaxial fabrics for wind and structural laminates | Stitched glass and carbon fabrics | View profile |
| Owens Corning → Praana Group | Glass reinforcements business sold 1 May 2026 at USD 645 million enterprise value, down from USD 755 million at signing | Advantex and high-modulus wind grades transferred | — |
| Nittobo | T-glass low-CTE cloth sold out; FY2027 electronic materials profit target raised | T-glass for high-end PCB; not an aircraft supplier | — |
Source: Company annual and interim reports (Jushi [S10]; CPIC [S9]), press releases (Owens Corning [S11]); CR3 share of Chinese output above 60% (end-2024 estimates 62% to about 70% depending on source).
4. Why eVTOL airframes are carbon fiber: specific modulus and a three-year lock-in
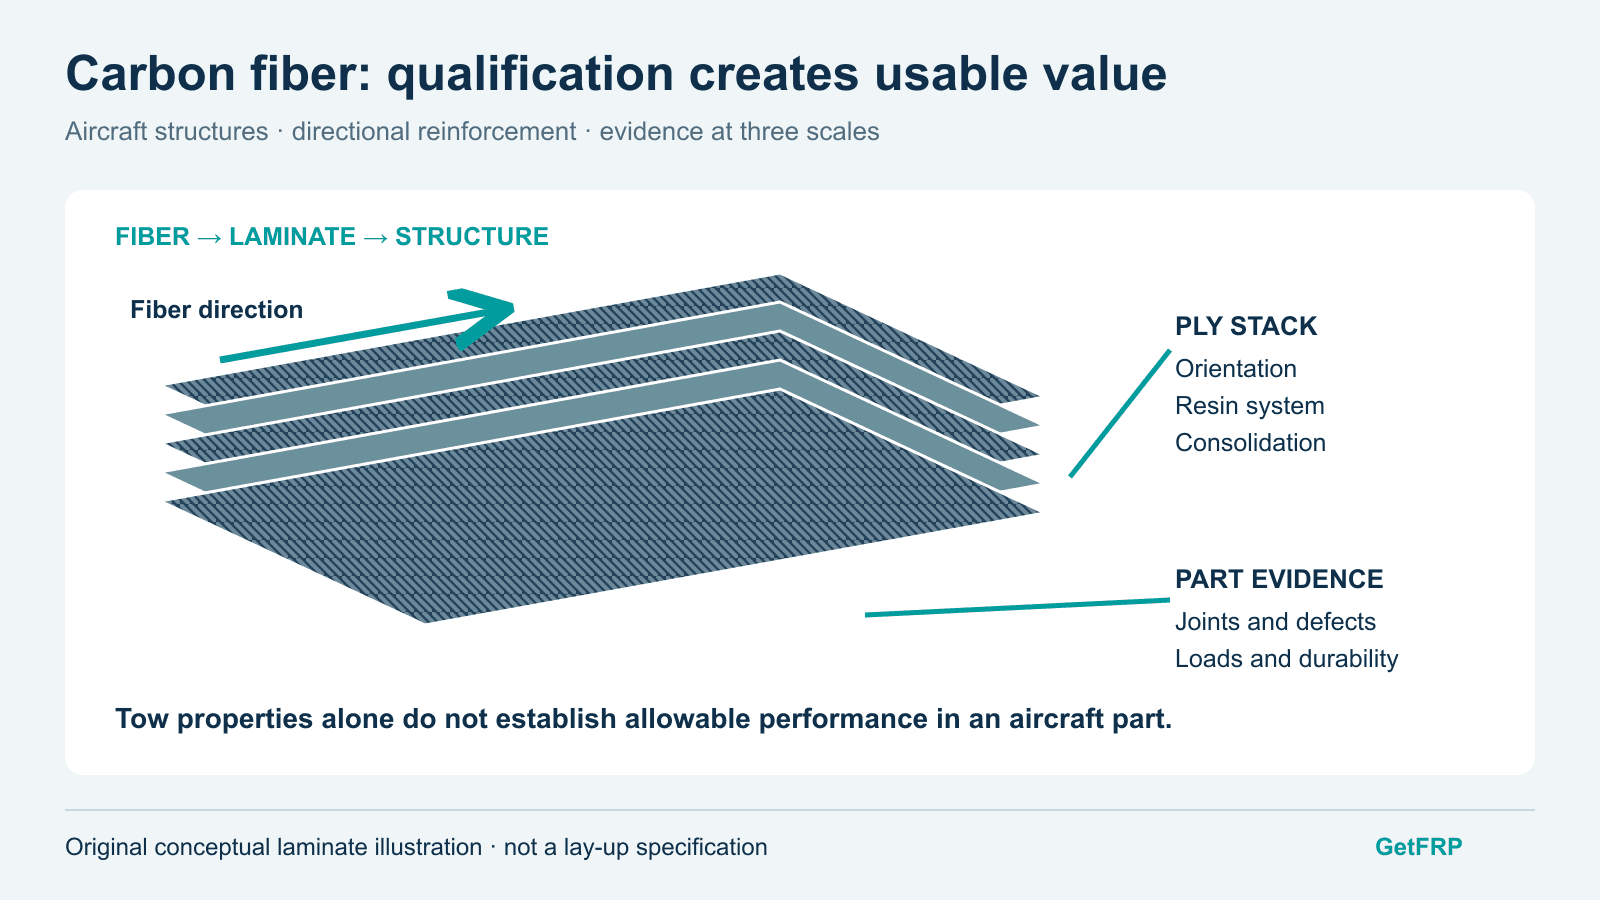
Three facts set the division of labor between the fibers. First, specific stiffness: Toray T700S has a typical tensile modulus of 230 GPa at 1.80 g/cm³ [company datasheet] [S7], while AGY lists E-glass at 72.3 GPa and 2.58 g/cm³ and S-2 Glass at 86.9 GPa and 2.46 g/cm³ [company datasheet] [S6]. That gives T700S a specific modulus near 128 GPa·cm³/g against 28 for E-glass and 35 for S-2 [estimate]. On battery-powered aircraft every kilogram saved returns about 3 km of range in the engineers' rule of thumb [media, 36Kr] [S20], so every certified or near-certified eVTOL uses T700/T800-class carbon fiber with epoxy prepreg for primary structure.
Second, price: E-glass roving at RMB 3.6 to 3.9/kg [S3] against a Chinese carbon fiber market average of RMB 85.5/kg in November 2026 [S15] is a 22- to 24-fold spread before aerospace-grade premiums [estimate]. Third, certification lock-in: changing a qualified material means repeating static and fatigue testing, roughly three years of work [media, 36Kr] [S20]. That is why OEMs sign with one material supplier early and why the T700/T800 epoxy system will dominate eVTOL structures to 2030 even as T1100 and T1200 fibers become available.
↔ Scroll horizontally to see the full chart and data table.
Source: Modulus and density from Toray CMA and AGY datasheets; ratio calculated by GetFRP. * Fiber-level typical values, not laminate allowables.
View the chart data and evidence
| Series | Category | Value | Unit | Evidence / value basis | Reported range | Point note |
|---|---|---|---|---|---|---|
| — | E-glass | 28 | GPa·cm³/g | GetFRP estimate | — | — |
| — | S-2 Glass (AGY) | 35 | GPa·cm³/g | GetFRP estimate | — | — |
| — | T700S (Toray) | 128 | GPa·cm³/g | GetFRP estimate | — | — |
| — | T800S (Toray) | 163 | GPa·cm³/g | GetFRP estimate | — | — |
↔ Scroll horizontally to see the full chart and data table.
- Structure and propulsion75–80%
- Interiors12–14%
- Battery and avionics8–12%
Source: Stratview Research via China Composites Industry Association (2024). Bar widths use range midpoints.
View the chart data and evidence
| Series | Category | Value | Unit | Evidence / value basis | Reported range | Point note |
|---|---|---|---|---|---|---|
| — | Structure and propulsion | 77.5 | % | Chart input; see reported range | 75–80% | — |
| — | Interiors | 13 | % | Chart input; see reported range | 12–14% | — |
| — | Battery and avionics | 9.5 | % | Chart input; see reported range | 8–12% | — |
| Property | E-glass | S-2 Glass | T700S carbon | T800S carbon |
|---|---|---|---|---|
| Tensile modulus (GPa) | 72.3 | 86.9 | 230 | 294 |
| Tensile strength (MPa) | 3,445 (pristine filament, 23°C) | 4,890 (pristine filament, 23°C) | 4,900 (impregnated strand) | 5,880 (impregnated strand) |
| Density (g/cm³) | 2.58 | 2.46 | 1.80 | 1.80 |
| Specific modulus (GPa·cm³/g) [estimate] | about 28 | about 35 | about 128 | about 163 |
| Dielectric constant at 10 GHz | 6.10 | 5.21 | conductive, not transparent | conductive, not transparent |
| Indicative price | RMB 3,600–3,900/t roving (2026) | not publicly quoted | China market average RMB 85.5/kg across grades (3 Nov 2026) | grade premium over T700; not publicly quoted |
| Typical low-altitude position | interiors, insulation, drone housings, ground structures | secondary structure, fairings, landing gear | primary structure, blades, arms | high-load primary structure |
Source: AGY S-Series property table [S6]; Toray CMA TORAYCA datasheet [S7]; Toray Advanced Composites radome selector guide [S26]; Sublime China Information [S3]; Baiinfo [S15]. Pristine glass filament and impregnated carbon strand strengths use different test methods and compare only in order of magnitude.
5. Where glass fiber still wins on aircraft: radomes, insulation, fire and impact
Carbon fiber conducts electricity and shields radio waves, so it cannot be used for any transparent window. Low-altitude aircraft carry obstacle-avoidance radar, command-and-control data links, ADS-B and 5G-A antennas, and each needs a radome or antenna cover made from glass or quartz fiber. At 10 GHz, S-glass has a dielectric constant of about 5.2 against 6.1 for E-glass [company, Toray Advanced Composites] [S26], and Saint-Gobain Quartzel quartz fiber 3.74 with a loss tangent of 0.0002 [company datasheet] [S8]. Buyers specifying radomes should ask for dielectric constant and loss tangent measured at the operating frequency and after humid aging; a 1 MHz datasheet value does not describe radar-band behavior.
Within aerospace composites, JEC's 2024 data gives 74% carbon fiber, 20% glass fiber and 6% aramid; across all composites glass fiber still holds more than 90% of 13.5 million t of global output [statistic, JEC Observer] [S4].
↔ Scroll horizontally to see the full chart and data table.
Source: Toray Advanced Composites radome selector guide for E- and S-glass; Saint-Gobain Quartzel roving datasheet
View the chart data and evidence
| Series | Category | Value | Unit | Evidence / value basis | Reported range | Point note |
|---|---|---|---|---|---|---|
| — | E-glass | 6.1 | Not specified | Company data | — | — |
| — | S-glass | 5.2 | Not specified | Company data | — | — |
| — | Quartz fiber (Quartzel) | 3.74 | Not specified | Company data | — | — |
| Component | Dominant material | Glass fiber role | Evidence level |
|---|---|---|---|
| Fuselage, wing, booms (primary structure) | T700/T800 carbon epoxy prepreg | Essentially none | Sourced: OEM and supplier announcements |
| Rotor and propeller blades | Carbon prepreg; thermoplastic carbon; PEEK | Carbon/glass hybrid possible in root toughness zones | Carbon sourced; hybrid is engineering inference |
| Drone arms | Carbon tubes (roll-wrapped, pultruded, one-piece molded) | Glass-filled nylon injection parts on entry-level models | Carbon sourced (patent CN114103163B); glass is inference |
| Radomes and antenna covers | E-glass, low-dielectric glass, quartz with PTFE or cyanate ester | Primary material; carbon excluded by conductivity | Material route sourced; specific aircraft use is inference |
| Battery enclosure | Carbon or glass composite covers | Insulating lids, separators, thermal-runaway barriers | Inference; CPIC exhibited a battery-pack glass grade in 2026 |
| Interiors | Composite interiors 12–14% of use | Flame-retardant, low-smoke glass/phenolic panels | Share sourced; material is engineering practice |
| Vertiports, charging stations, flight-service stations | Pultruded GFRP grating and profiles | Primary material: insulating, corrosion-resistant, light | Inference |
Source: See Sources; rows marked inference are GetFRP engineering judgment, not supplier claims.
6. Demand scenarios: thousands of tonnes, not tens of thousands
The arithmetic is modest. If China's often-quoted white-paper figure of 12,000 new passenger eVTOLs a year by 2030 were fully delivered at 100 to 400 kg each, carbon fiber demand would be 1,200 to 4,800 t a year, or 0.5 to 2.1% of 2025 global demand [estimate], using Debon Securities' per-aircraft range [S19] and Sail's 2025 total [S1]. The roughly 6,300 global eVTOL orders Cirium counted in May 2023 translate to 630 to 2,520 t cumulative. Wind energy added about 56,000 t of carbon fiber demand in 2025 alone. Production rates confirm the scale: Joby's near-term target is four aircraft a month by 2027 and Archer plans two a month.
One widely circulated figure needs correcting: the claim that eVTOL thermoplastic demand rises from 500 t in 2024 to 11,750 t in 2030 is Stratview's forecast for all eVTOL composites, of which thermoplastics are under 10%. Thermoplastic carbon fiber composites were about USD 1.52 billion in 2025, roughly 5% of resin-based carbon composites, and mostly discontinuous-fiber compounds; continuous-fiber thermoplastics were only about USD 0.5 billion [survey, Sail] [S1]. The value for material producers lies in aerospace-grade prepreg, qualified allowables databases and long supply agreements, not in tonnage.
↔ Scroll horizontally to see the full chart and data table.
Source: GetFRP scenarios from Debon Securities per-aircraft range and the China 2030 white-paper fleet figure; Sail for market totals. * Low case 12,000 eVTOLs × 100 kg; high case 12,000 × 400 kg per year.
View the chart data and evidence
| Series | Category | Value | Unit | Evidence / value basis | Reported range | Point note |
|---|---|---|---|---|---|---|
| — | Low-altitude, low case | 1200 | t | GetFRP estimate | — | — |
| — | Low-altitude, high case | 4800 | t | GetFRP estimate | — | — |
| — | Wind blade increase, 2025 | 56000 | t | GetFRP estimate | — | — |
| — | Global demand, 2025 | 224510 | t | GetFRP estimate | — | — |
| Scenario | Fleet assumption | Fiber per aircraft | Demand | Share of 2025 global demand |
|---|---|---|---|---|
| Global order book fully delivered (cumulative) | 6,300 aircraft (Cirium, May 2023) | 100–400 kg | 630–2,520 t | 0.3–1.1% |
| China 2030 white paper (annual) | 12,000 new aircraft per year | 100–400 kg | 1,200–4,800 t/yr | 0.5–2.1% |
| Against Toray's narrower 138 kt series | as above | 100–400 kg | 1,200–4,800 t/yr | 0.9–3.5% |
Source: Fleet and per-aircraft inputs from broker and consultancy sources; the white-paper document itself was not located and the figure is treated as unverified.
7. Supply chain map: one material supplier per OEM
Internationally the pattern is exclusive pairing. In China the state aerospace system moved first: AVIC claims to supply more than 90% of the EH216's carbon fiber (trade-show statement), Zhongfu Shenying is reported to supply EHang and XPeng AeroHT directly or indirectly, Guangwei has started a light-aircraft composite structures project, Zhongjian Technology reports civil products in customer validation, HRC supplies carbon fiber structures to a Chinese eVTOL developer, and Wote Advanced Materials supplies PEEK for drone blades. Almost no structural contract value has been disclosed.
Glass fiber leaders including Jushi, Taishan and CPIC have the relevant grades, but none has announced a low-altitude order; CPIC's investor-relations position is that it sells base material and has no direct business with end customers [company]. For buyers, the practical consequence is counterparty risk on both sides: Lilium's collapse pushed its battery supplier CustomCells into insolvency, which blamed tens of millions of dollars in unpaid bills [media, Aviation Week] [S29].
| Material supplier | OEM | Scope | Evidence grade |
|---|---|---|---|
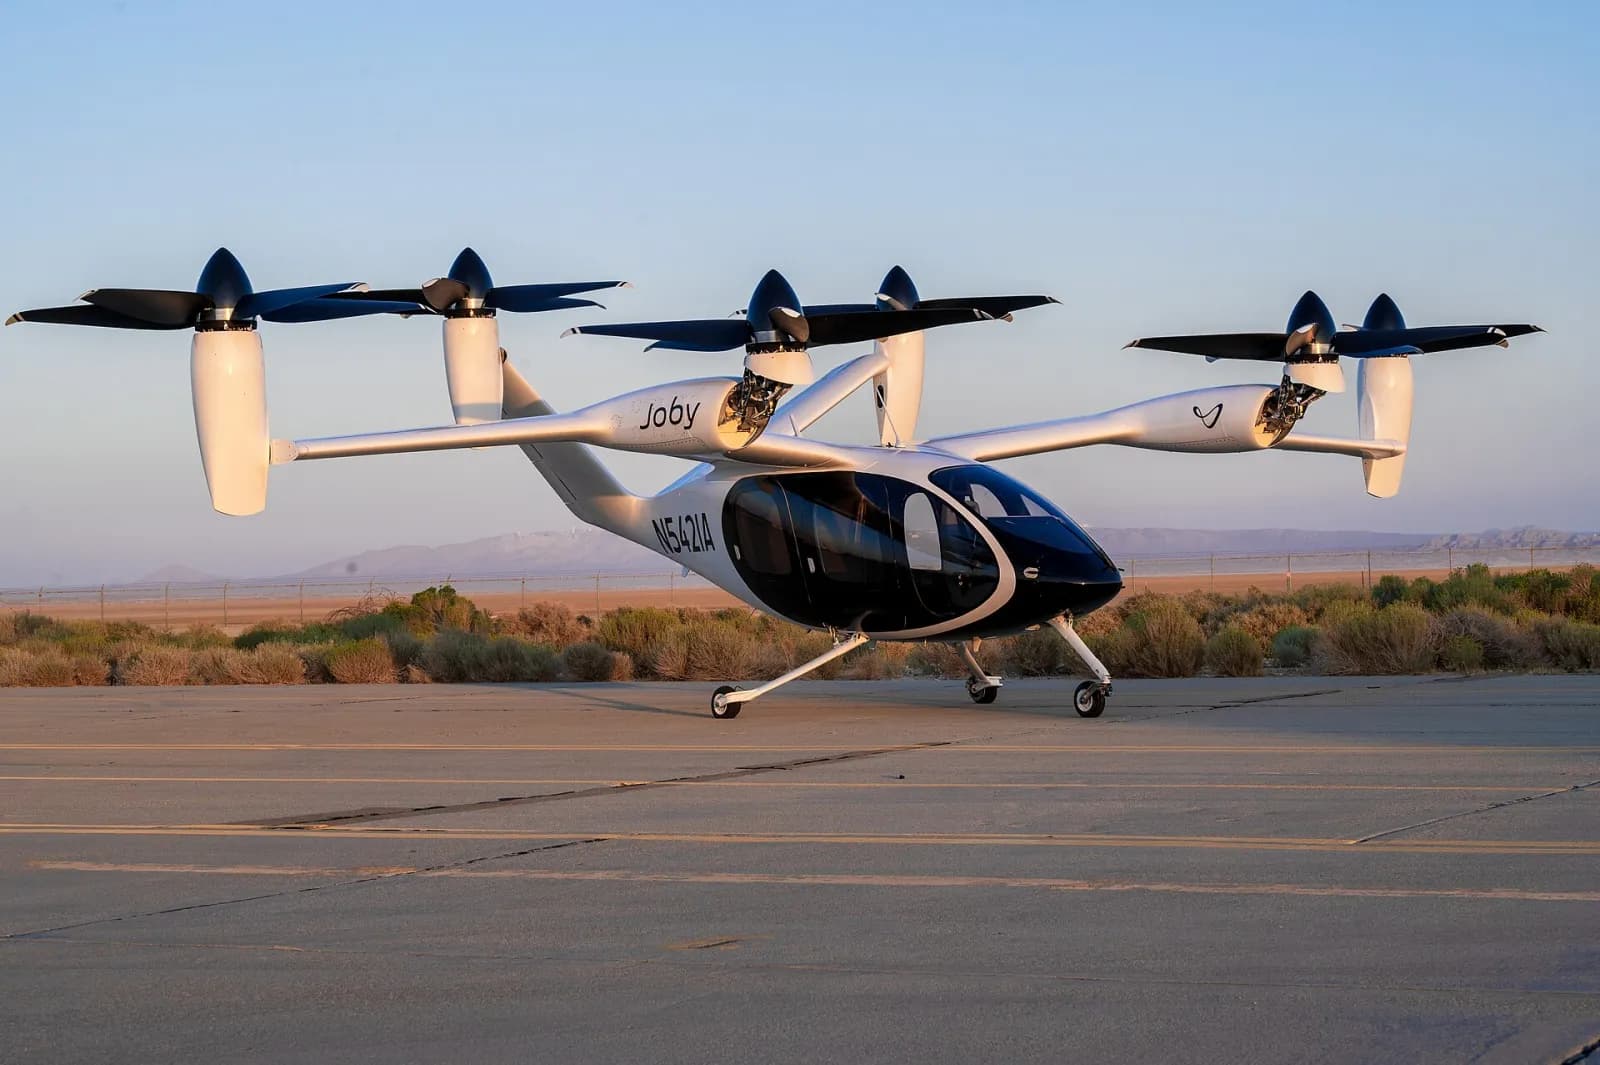
| Toray | Joby Aviation | Long-term carbon fiber composite supply for airframe, propulsion and interiors (Dec 2020) | Announced agreement |
| Hexcel | Archer Aviation | Letter of intent (Apr 2022) to supply carbon fiber prepreg for Archer's production aircraft | LOI only; no definitive contract published |
| Syensqo | Vertical Aerospace | Long-term supply of all VX4 structural composites and adhesives (Dec 2025); also supplies Beta | Announced agreement |
| Qarbon Aerospace | Supernal | Induction-welded thermoplastic carbon airframe | Announced partnership |
| AVIC | EHang | More than 90% of EH216 carbon fiber | Trade-show statement |
| Zhongfu Shenying | EHang, XPeng AeroHT | Direct or indirect carbon fiber supply | Media reports |
| HRC | Chinese eVTOL developer | Carbon fiber structural components | Company statement |
Source: CompositesWorld [S16], Archer investor relations [S17], Business Wire [S18], JEC World 2024 exhibitor material, Chinese financial media.
8. Manufacturing routes and five trends to 2030
Certified programs use aerospace routes: autoclave or out-of-autoclave prepreg laid by hand or by automated fiber placement, as at Joby's Marina plant. Rate pressure is shifting the industry toward RTM, HP-RTM and compression molding for frames and brackets, and toward thermoplastic forming with induction, ultrasonic or laser welding to remove fasteners; Airbus's MFFD demonstrator targets 60 to 100 fuselages a month with laser-welded 8 m seams. Drone arms are filament-wound or pultruded carbon tubes, and pultruded GFRP serves ground infrastructure.
| Trend | Window | Carbon fiber suppliers | Glass fiber suppliers | Basis |
|---|---|---|---|---|
| Thermoplastics plus welding | 2026–2030 | Thermoplastic tape and PEEK systems for blades and secondary structure | Long-fiber and chopped thermoplastic yarn for drone housings and brackets | Estimate; Supernal, ENGEL and MFFD precedents |
| T700/T800 lock-in | to 2030 | Qualified suppliers keep incumbency; new entrants need about three years | Not directly relevant | Sourced plus estimate |
| Carbon fiber oversupply | 2026–2027 | Price pressure as Chinese capacity may pass 250,000 t | Mid-range drone structural parts migrate to carbon | Estimate from announced projects |
| Transparent-material demand | 2026–2030 | Not applicable (conductive) | Low-dielectric and quartz grades spill over from AI PCB to airborne radomes | Estimate; CPIC and Taishan capacity disclosures |
| Recycling and trade policy | ongoing | Recycled carbon fiber at about 2.5 kg CO₂/kg vs 19.9 virgin; export controls | EU duties push overseas bases | JEC (7.5 Mt waste, about 4% recycled); EU regulations |
9. What this means for buyers sourcing composites from China
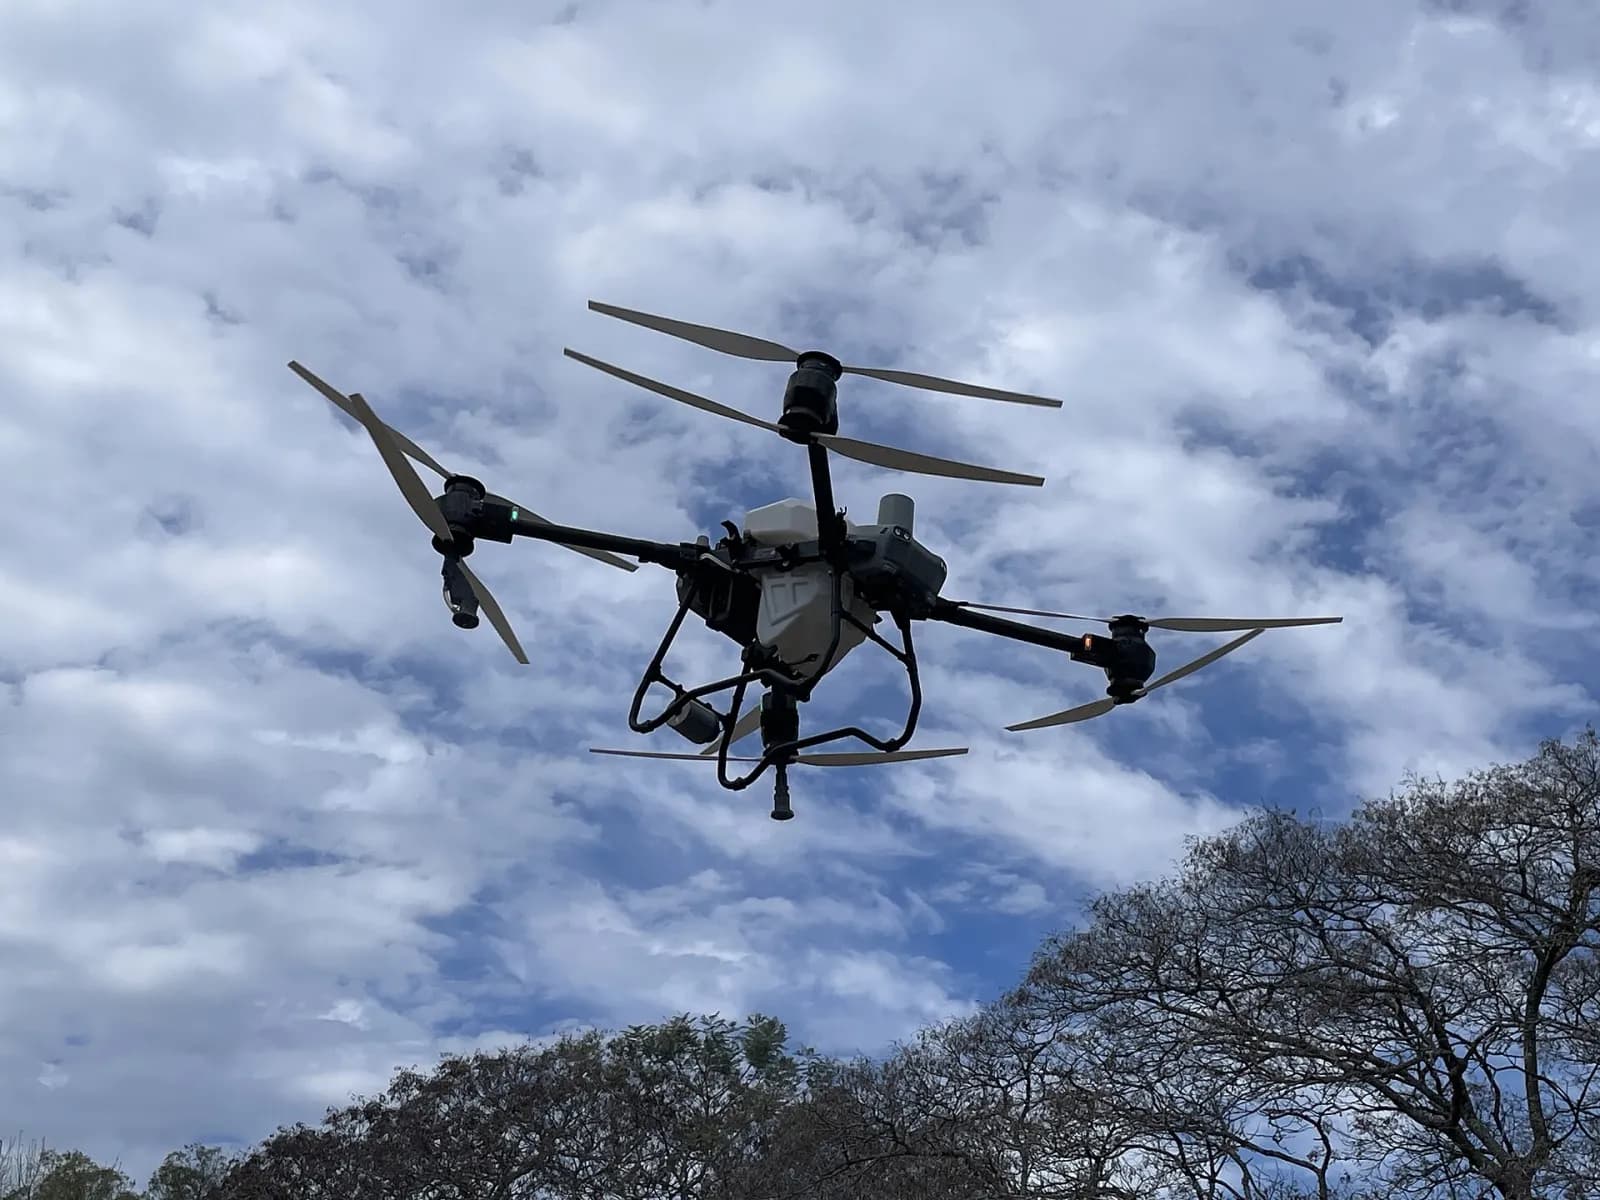
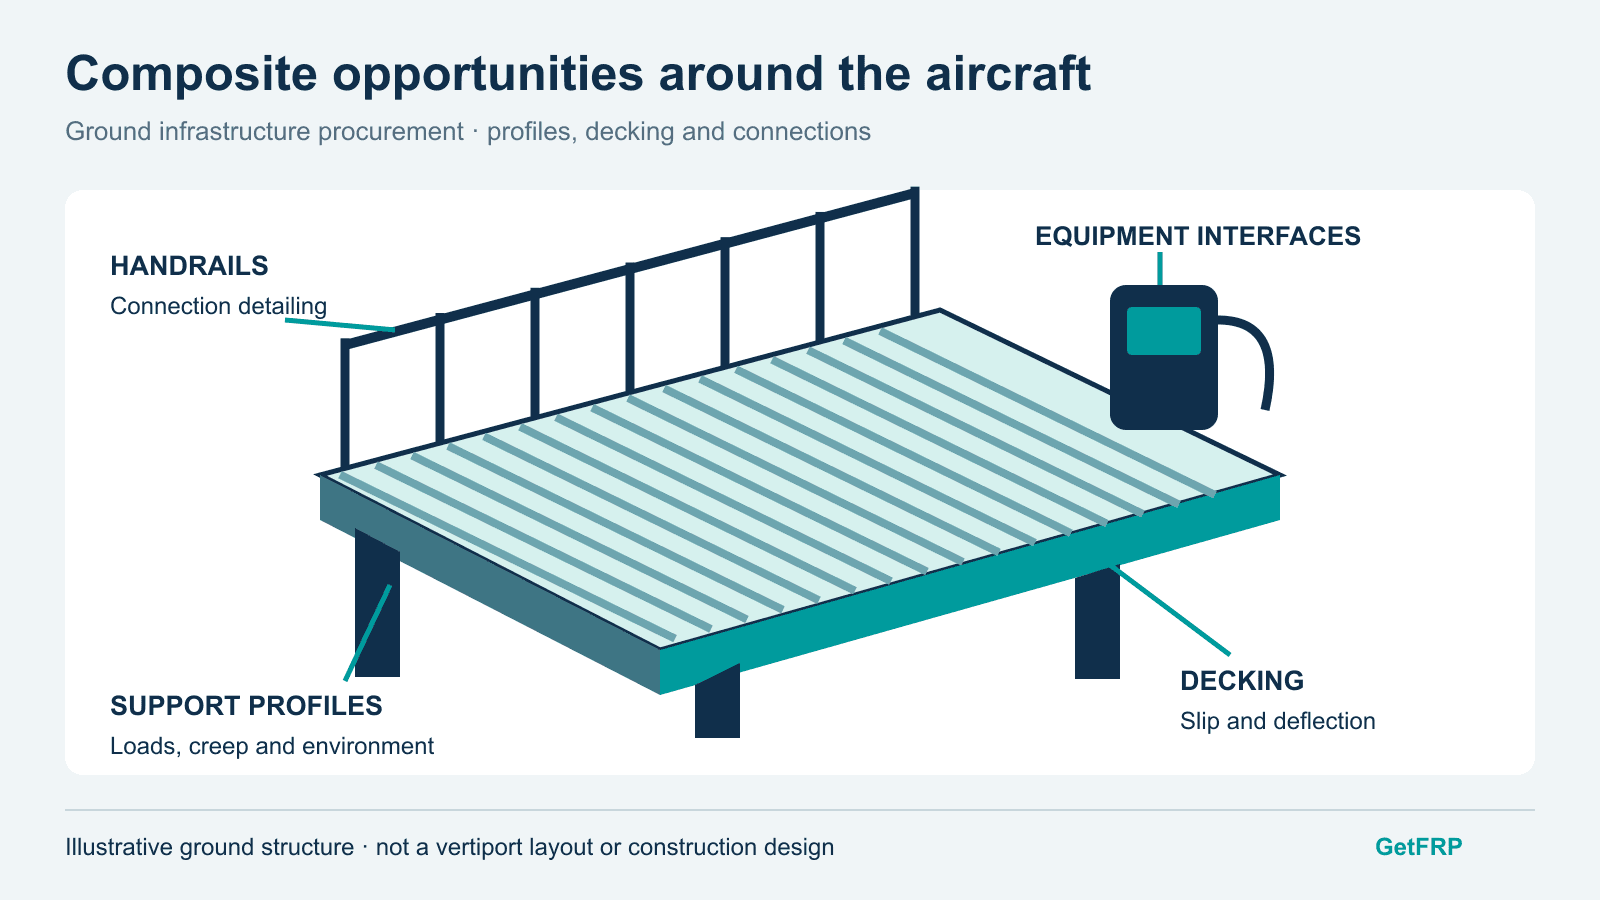
Ground infrastructure moves before fleets. Vertiports, charging stations and the 46 networked flight-service stations China counted at end-2025 [S22] need insulating, corrosion-resistant pultruded profiles and grating, which is where Chinese pultrusion capacity is deepest and lead times shortest. Drone structures are a mature export category: carbon fiber arms, tubes and glass-filled engineering-plastic housings are produced at scale for consumer, agricultural and logistics drones.
- Request material test certificates against EN 13706 or ASTM methods rather than nominal datasheet values, and keep fiber-level data separate from laminate data.
- For radomes and antenna covers, ask for dielectric constant and loss tangent at the operating frequency (GHz, not 1 MHz) and after humid aging.
- For eVTOL primary structure, plan for three-year qualification cycles, OEM-controlled material specifications and counterparty risk on both sides of the contract.
- GetFRP supplier profiles attribute company statements; they do not replace order-specific test evidence or a scoped factory review.
Where composite demand arrives first
Vertiports and charging infrastructure are built before fleets scale. The VoloPort prototype in Singapore (2019) and China's 46 flight-service stations at end-2025 are the leading indicators to watch for pultruded GFRP demand.
Frequently asked questions
How much carbon fiber does one eVTOL use?
Debon Securities estimates 100 to 400 kg per aircraft, and industry reporting puts carbon fiber structures at about 15 to 20% of aircraft cost. OEMs have not published exact mass fractions, so treat the range as a broker estimate.
Is the low-altitude economy a large market for glass fiber?
No. China produced 8.43 million t of glass fiber yarn in 2025; aircraft use is negligible in tonnage. The opportunities are radomes, insulation, fire barriers, drone housings and pultruded ground infrastructure.
Is China's low-altitude economy worth RMB 1.5 trillion today?
That figure is a CAAC forecast for 2025 relayed by media. CCID Consulting estimated 2024 at RMB 670.25 billion, covering manufacturing, infrastructure, operations and services. The hard statistics are drones: 3.287 million registered at end-2025 and 45.3 million flight hours in the year, per CAAC.
Which carbon fiber grades do eVTOL programs use?
Certified and near-certified programs use T700/T800-class fiber with epoxy prepreg. T1100 and T1200 fibers exist at 100-tonne scale in China but requalification takes about three years, so they will appear only in local high-load parts before 2030.
Can carbon fiber be used for a drone radome?
No. Carbon fiber conducts and shields radio waves. Radomes use E-glass, S-glass, low-dielectric glass or quartz fiber, specified by dielectric constant and loss tangent at the operating frequency.
Why do the carbon fiber demand figures from Sail and Toray differ so much?
Sail counts 224,510 t for 2025, including about 100,000 t for wind blades, much of it Chinese large-tow fiber for pultruded spar caps; Toray's own estimate of 138 kt uses a narrower scope. Each series is internally consistent, but they cannot be averaged or compared year to year across series.
Sources and scope
Figures were cross-checked against primary documents where available; secondary citations are marked in each scope note. Company figures are reported as disclosed by the companies themselves. This note is an independent market assessment and not investment advice.
- [S1]Guangzhou Sail Carbon Fiber (Lin Gang): 2025 Global Carbon Fiber Composites Market Report, reproduced by China Composites Expo (15 April 2026)
Global demand 224,510 t (+43.8%), wind 100,000 t, sports 31,350 t, aerospace 30,000 t; aerospace 12.6% of composite volume and 60.8% of value; China demand 132,027 t with 85.9% domestic supply; operating capacity 171,080 t in China and 326,080 t globally; China utilization 66.3%; average Chinese-supplied fiber price USD 33/kg (2022) and USD 18/kg (2025); thermoplastic composites USD 1.52 billion. One consultancy's methodology; Chinese-language text.
- [S2]China Glass Fiber Industry Association: 2025 annual development report
China glass fiber yarn output, new capacity, apparent consumption and trade for 2025; association statistics relayed by a news portal.
- [S3]Securities Star via NetEase: glass fiber industry review citing Sublime China Information prices and CGFIA flash data (13 October 2026)
2400 tex roving RMB 3,791/t (end-June 2026) and RMB 3,732/t (15 Sep 2026); G75 yarn RMB 23,450/t (+167.4%); 7628 cloth RMB 5.15, 6.73 and 10.2/m (Q1, Q2, Aug 2026); Caitong Securities price-cycle peak of RMB 7,008/t in Nov 2021 (a broker composite glass fiber series, not the 2400 tex roving average); end-June 2026 capacity 9.3 Mt with 8.65 Mt tank capacity in production. Secondary summary of association and price-agency data.
- [S4]JEC Observer: Overview of the Global Composites Market 2024–2029
Global composites volume, fiber shares in aerospace composites and composite waste estimates; consultancy data.
- [S5]Toray Industries: Carbon Fiber Composite Materials investor presentation (June 2026)
Toray's demand series to 2028, market share and segment profit; company view with its own scope definitions.
- [S6]AGY: S-Series High Performance Materials datasheet (E-, S-1 and S-2 Glass property table, archived copy)
Typical fiber properties: E-glass 2.58 g/cm³, 72.3 GPa, 3,445 MPa; S-2 Glass 2.46 g/cm³, 86.9 GPa, 4,890 MPa (pristine filament, 23°C). Fiber-level, not laminate allowables; the live AGY roving sheet gives only relative values.
- [S7]Toray Composite Materials America: TORAYCA fiber datasheet
T300 to M60J nominal strength, modulus and density; impregnated-strand values, not design allowables.
- [S8]Saint-Gobain: Quartzel roving datasheet (RO-A4-EN-02/25)
Dielectric constant 3.74 and loss tangent 0.0002 at 10 GHz for quartz fiber; manufacturer datasheet (site blocks automated access).
- [S9]Chongqing International Composite Materials: 2026 interim report
Top-three global capacity, leading wind-yarn position, low-dielectric generation 2, low-CTE and quartz (Q) cloth development, and a battery-pack glass grade exhibited in 2026; company statements. Sales volume and capacity figures in Table 3 come from 2025 disclosures.
- [S10]China Jushi: 2025 annual report summary
Sales volume, revenue and electronic cloth volume; company statements.
- [S11]Owens Corning: completion of sale of glass reinforcements business to Praana Group (May 2026)
Transaction value and closing date; company release.
- [S12]Commission Implementing Regulation (EU) 2026/1371 of 22 June 2026 correcting Implementing Regulation (EU) 2026/831 (anti-dumping duty on continuous filament glass fiber products from Bahrain, Egypt and Thailand)
Restated duty table applicable from 15 April 2026: Bahrain (CPIC Abahsain) 11.8%, Egypt (Jushi Egypt) 11.0%, Thailand 15.3–25.4%; CN 7019 11, ex 7019 12, 7019 14, 7019 15. Official Journal text (Spanish edition via BOE).
- [S13]Xinhua: CAAC low-altitude economy forecast (22 December 2025)
The RMB 1.5 trillion and 3.5 trillion figures as forecasts; the original CAAC document was not located.
- [S14]Beijing News: CAAC issues two mandatory national drone standards (23 December 2025)
Real-name registration and activation, and operational identification standards effective 1 May 2026; 2024 drone statistics. Official announcement relayed by media.
- [S15]Baiinfo: carbon fiber market prices
Daily Chinese carbon fiber market average, RMB 85.5/kg on 3 November 2026; the page updates daily. Price-agency data.
- [S16]CompositesWorld: Toray and Joby finalize long-term carbon fiber supply agreement
Scope of the Toray–Joby agreement; trade press report of a company announcement.
- [S17]Archer Aviation: plans to work with Hexcel (April 2022)
Letter of intent for carbon fiber prepreg supply for production aircraft; no definitive supply contract has been published.
- [S18]Business Wire: Vertical Aerospace partners with Syensqo for the VX4 (8 December 2025)
Long-term supply of composite and adhesive materials for the VX4 structure; 2028 certification target; company release.
- [S19]China Composites Industry Association (CCIA): eVTOL composites briefing (July 2024)
Carbon fiber above 90% of eVTOL airframe composites; Stratview use split (structure and propulsion 75–80%, interiors 12–14%, battery and avionics 8–12%); Debon Securities estimate of 100–400 kg carbon fiber per eVTOL. Consultancy and broker figures relayed by an industry association.
- [S20]36Kr: eVTOL carbon fiber structures and requalification (May 2026)
Cost share of carbon fiber structures, three-year requalification and range rule of thumb; industry journalism, not a company filing.
- [S21]AIN: Wanfeng's Diamond Aircraft absorbs eVTOL developer Volocopter (14 March 2025)
Volocopter assets acquired from the insolvency administrator for EUR 10 million; trade press.
- [S22]Xinhua (People's Posts and Telecommunications News): China's civil drone output value grew about 20% in 2025 (8 May 2026)
CAAC statistics at end-2025: 3.287 million registered drones (+51.0%), 45.30 million flight hours (+69.9%), 46 networked low-altitude flight-service stations in 23 provinces; official statistics relayed by state media.
- [S23]IT Home: CAAC mid-year work conference, real-name registered drones pass 4.788 million (15 July 2026)
First-half 2026 real-name drone registrations and flight hours from the CAAC website; official statement relayed by media.
- [S24]Xinhua: low-altitude economy takes off, CCID Consulting estimate for 2024 (25 December 2024)
CCID Consulting estimate of RMB 670.25 billion for China's 2024 low-altitude economy; a consultancy estimate, not an official statistic.
- [S25]Commission Implementing Regulation (EU) 2026/2107 of 22 September 2026 (expiry review: countervailing duty on continuous filament glass fiber products from Egypt)
Maintains the 13.1% countervailing duty on Jushi Egypt and all other Egyptian imports for five years. Official Journal text (Spanish edition via BOE).
- [S26]Toray Advanced Composites: Radome and Antenna Systems Advanced Composite Materials Selector Guide
Reinforcement dielectric constant at 10 GHz: E-glass 6.10, S-glass 5.21, quartz 3.78; laminate values by resin system. Manufacturer data.
- [S27]AutoFlight: V2000CG granted the first overseas eVTOL type certificate validation, in Indonesia (June 2026)
CAAC type certificate March 2024; Indonesian DGCA validated type certificate issued 3 June 2026; 2,000 kg maximum take-off weight. Company release.
- [S28]Aviation Week: Lilium files for bankruptcy again as funding proves elusive (21 February 2025)
Second Lilium insolvency filing on 21 February 2025, likely ending the Lilium Jet program; trade press.
- [S29]Aviation Week: Lilium failure takes down battery supplier CustomCells (May 2025)
CustomCells insolvency blamed on tens of millions of dollars in unpaid Lilium bills; trade press.
- [S30]Zhongfu Shenying Carbon Fiber: 2025 annual report (26 March 2026)
2025 carbon fiber production 22,488.86 t and sales 25,054.28 t (production and sales table); company filing.
- [S31]Qianzhan Industry Research: China glass fiber industry analysis (March 2021), quoting CGFIA 2020 data
2020 yarn output 5.41 Mt, up 2.64%; pool-kiln yarn 5.02 Mt. Consultancy compilation quoting the association.
- [S32]Huaon Industry Research: China glass fiber industry 2021 (CGFIA data)
2021 yarn output 6.24 Mt, up 15.2%. Consultancy compilation quoting the association.
- [S33]Huaon Industry Research: China glass fiber industry 2022 (CGFIA data)
2022 yarn output 6.87 Mt, up 10.2%. Consultancy compilation quoting the association.
Image provenance and usage terms appear in each caption; see image credits. Submit a source correction.